Name Synaptic Mobile App
Overview Insights by Synaptic puts alternative data on 500,000+ private companies in an investor's pocket. The desktop platform was built for long research sessions; the app had to work in the ten minutes before a meeting. The design centres on four moves: search across 450,000+ companies, a company overview that organises every dataset into one readable story, a Cheat Sheet that surfaces only what changed since you last looked, and a personalised inbox of signals on the companies you track.
My Role UI/UX Design, Interaction Design, Design System
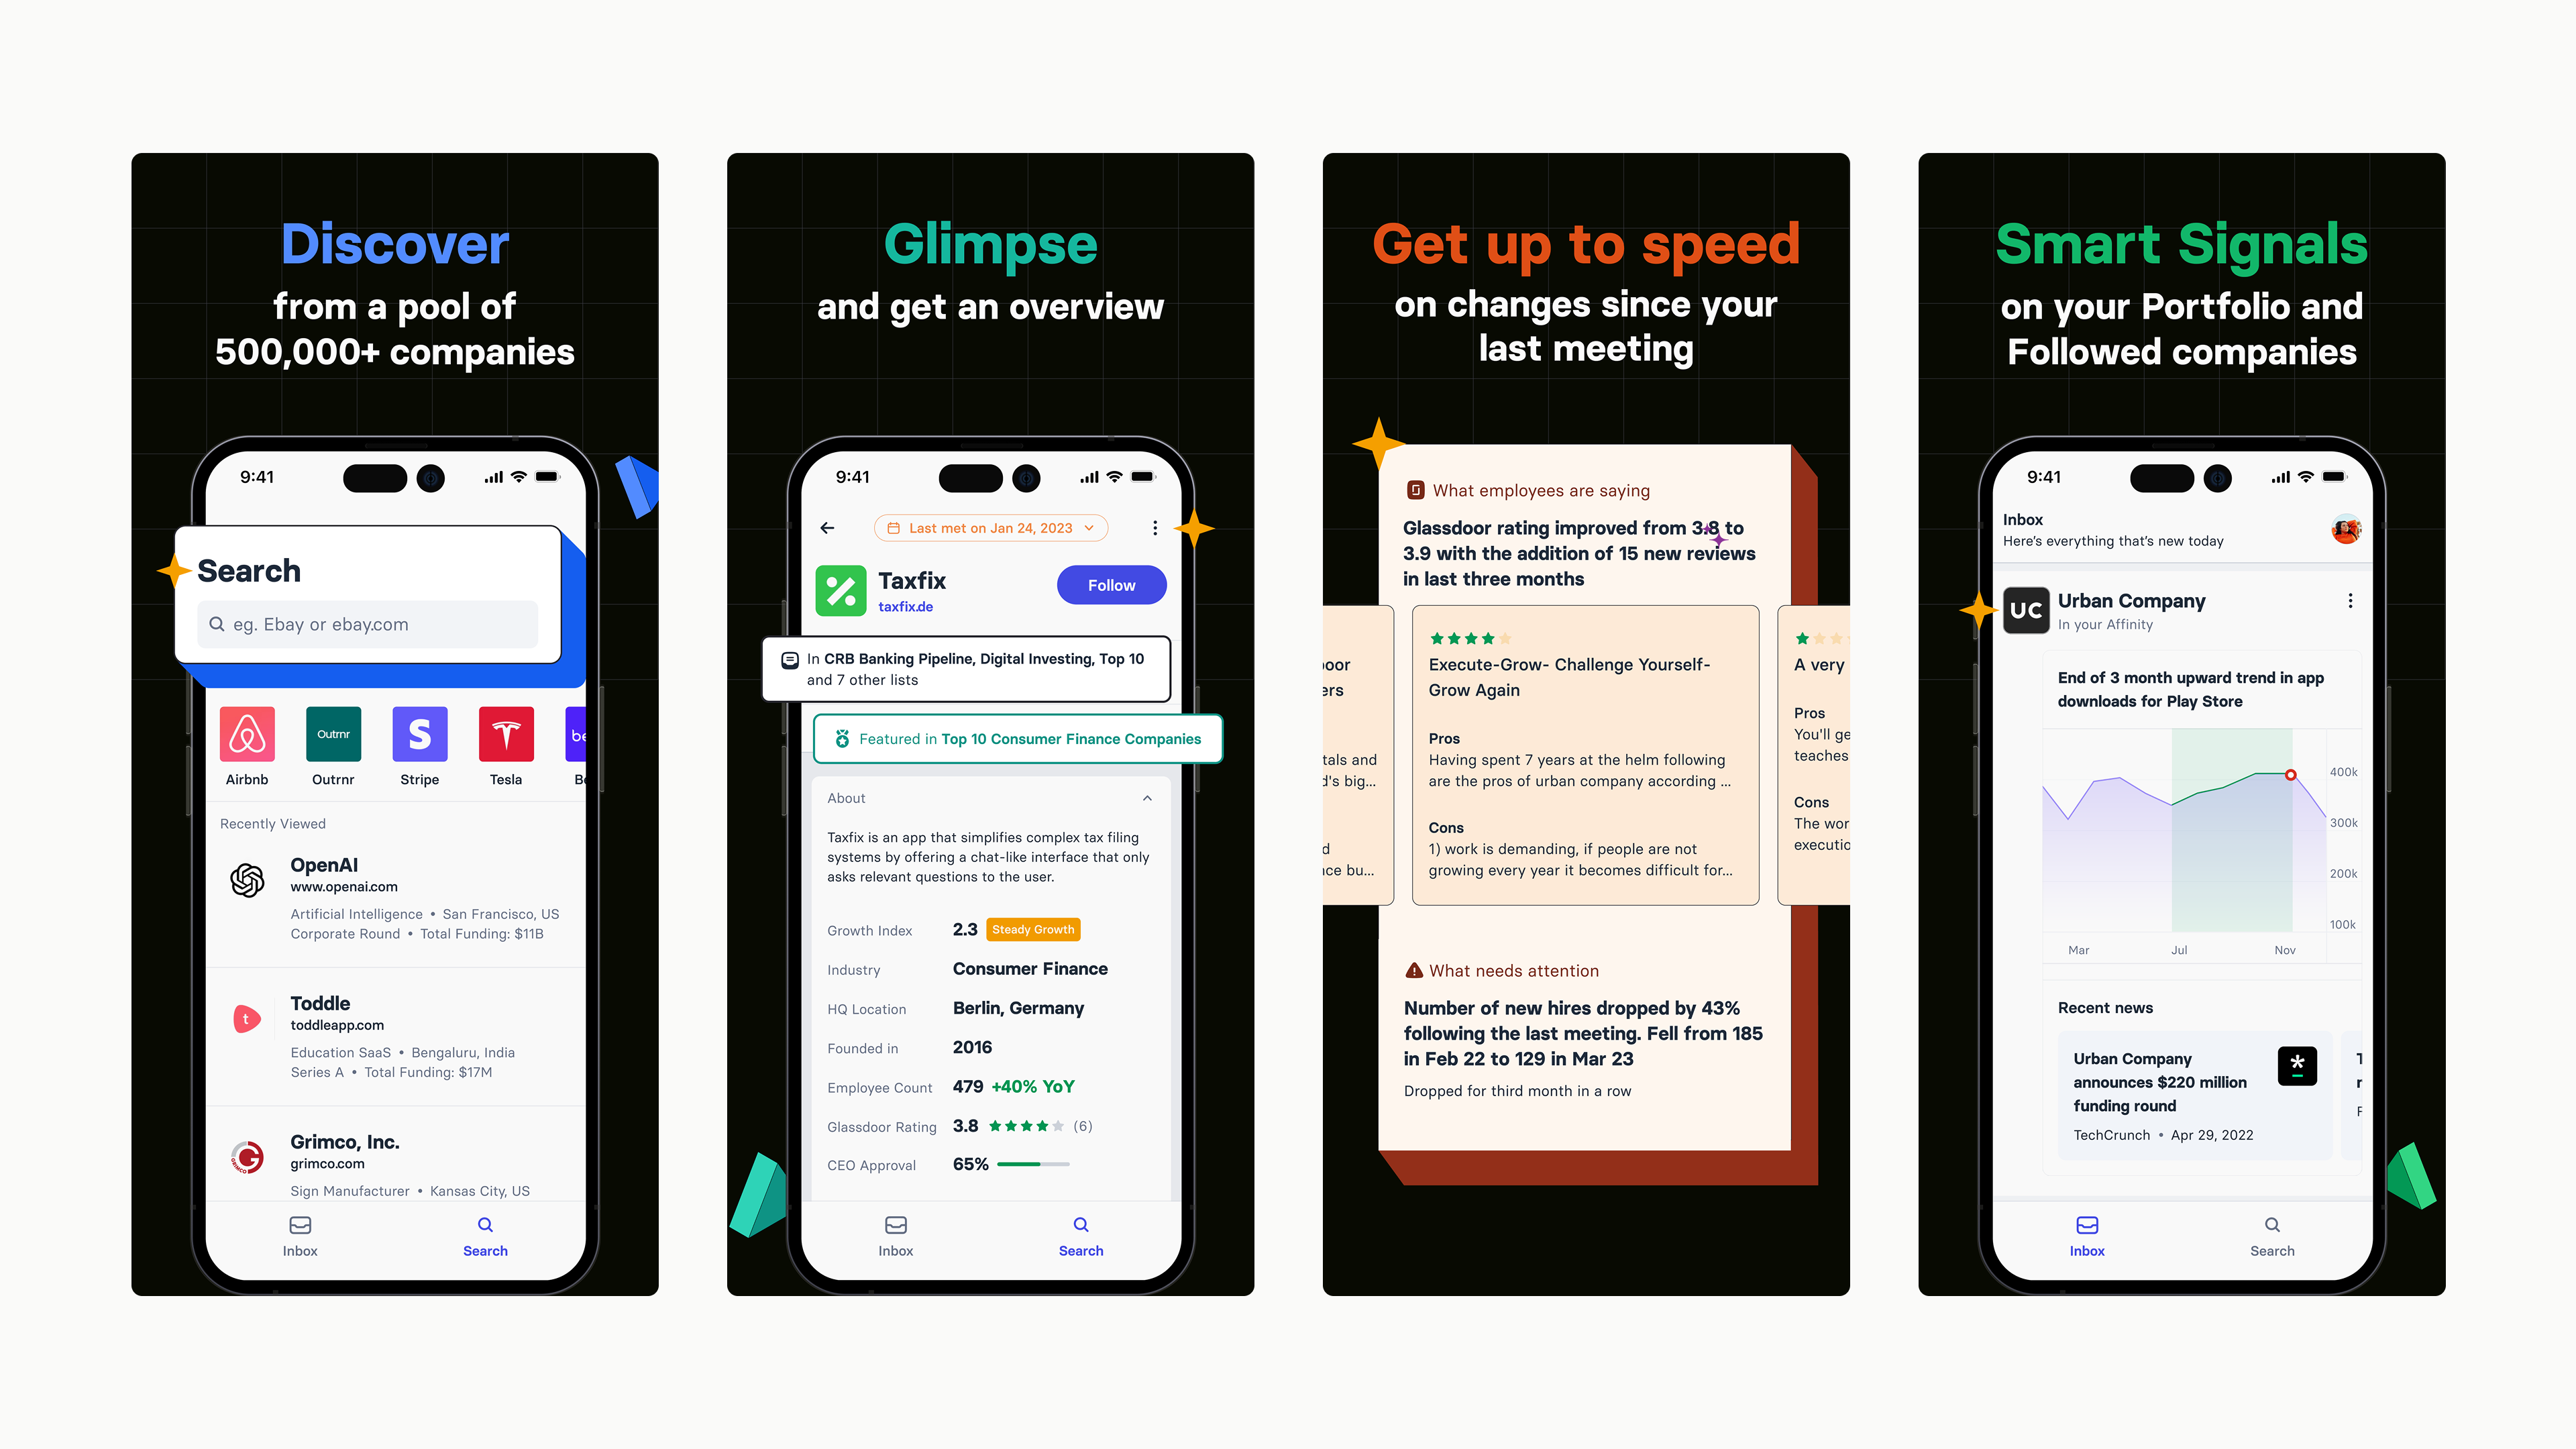
App Store screenshots for Insights by Synaptic: discover from a pool of 500,000+ companies, glimpse and get an overview, get up to speed on changes since your last meeting, and smart signals on your portfolio and followed companies
Launch screen animation: the Synaptic mark drawing itself in cyan on black
Launch animation · Home screen widget
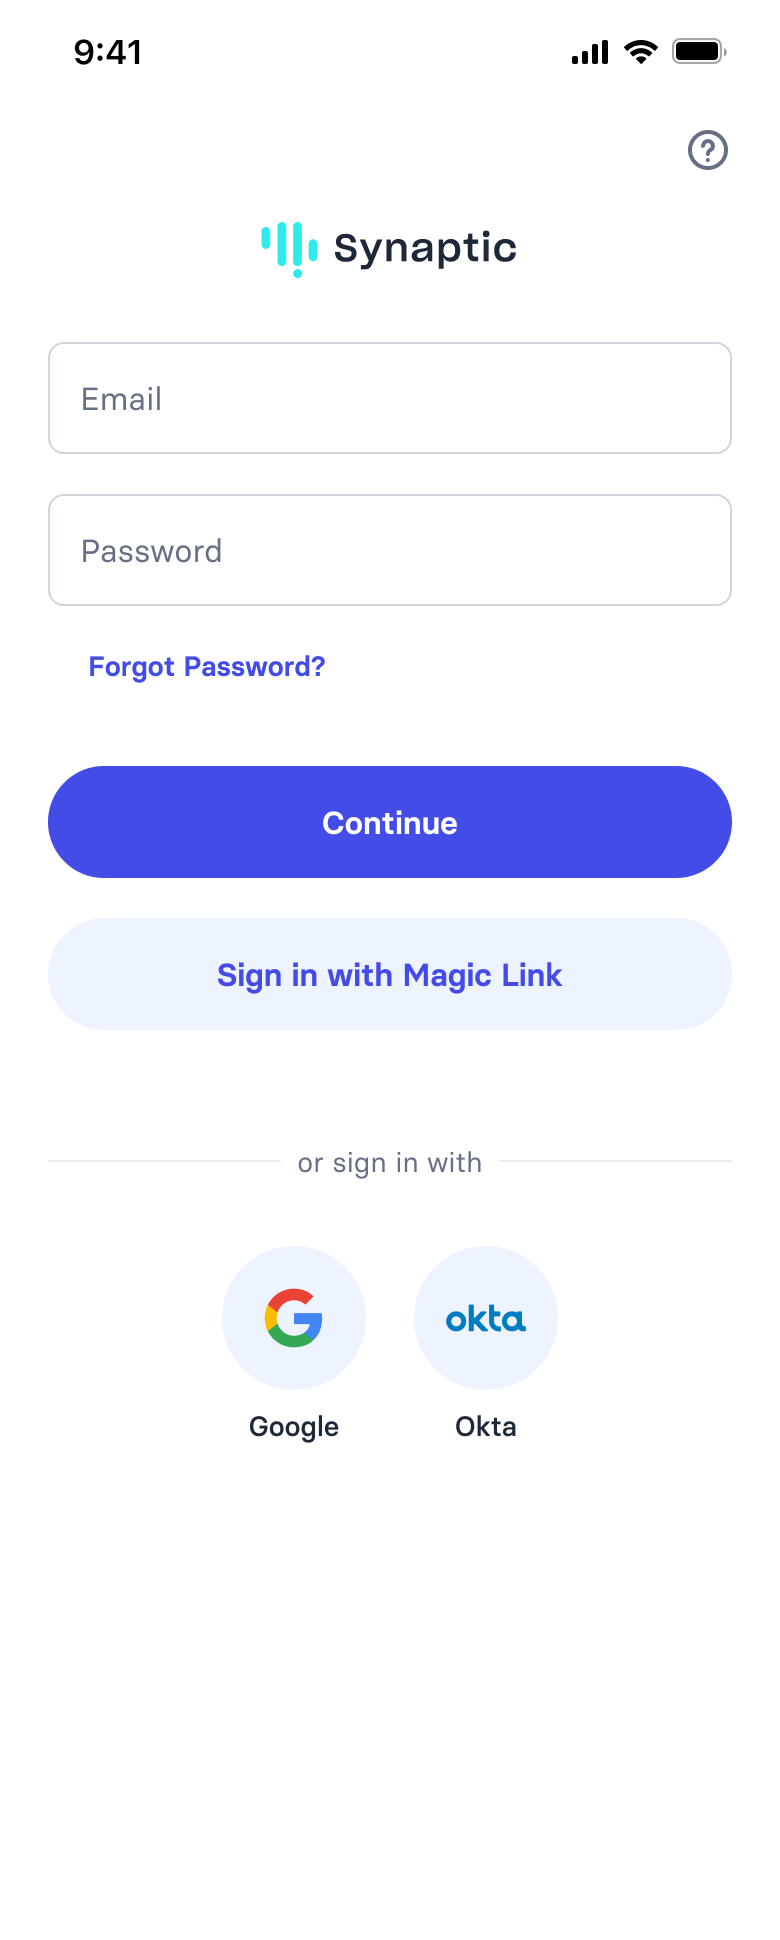
Sign in screen with email and password fields, a magic link option, and Google and Okta sign-in
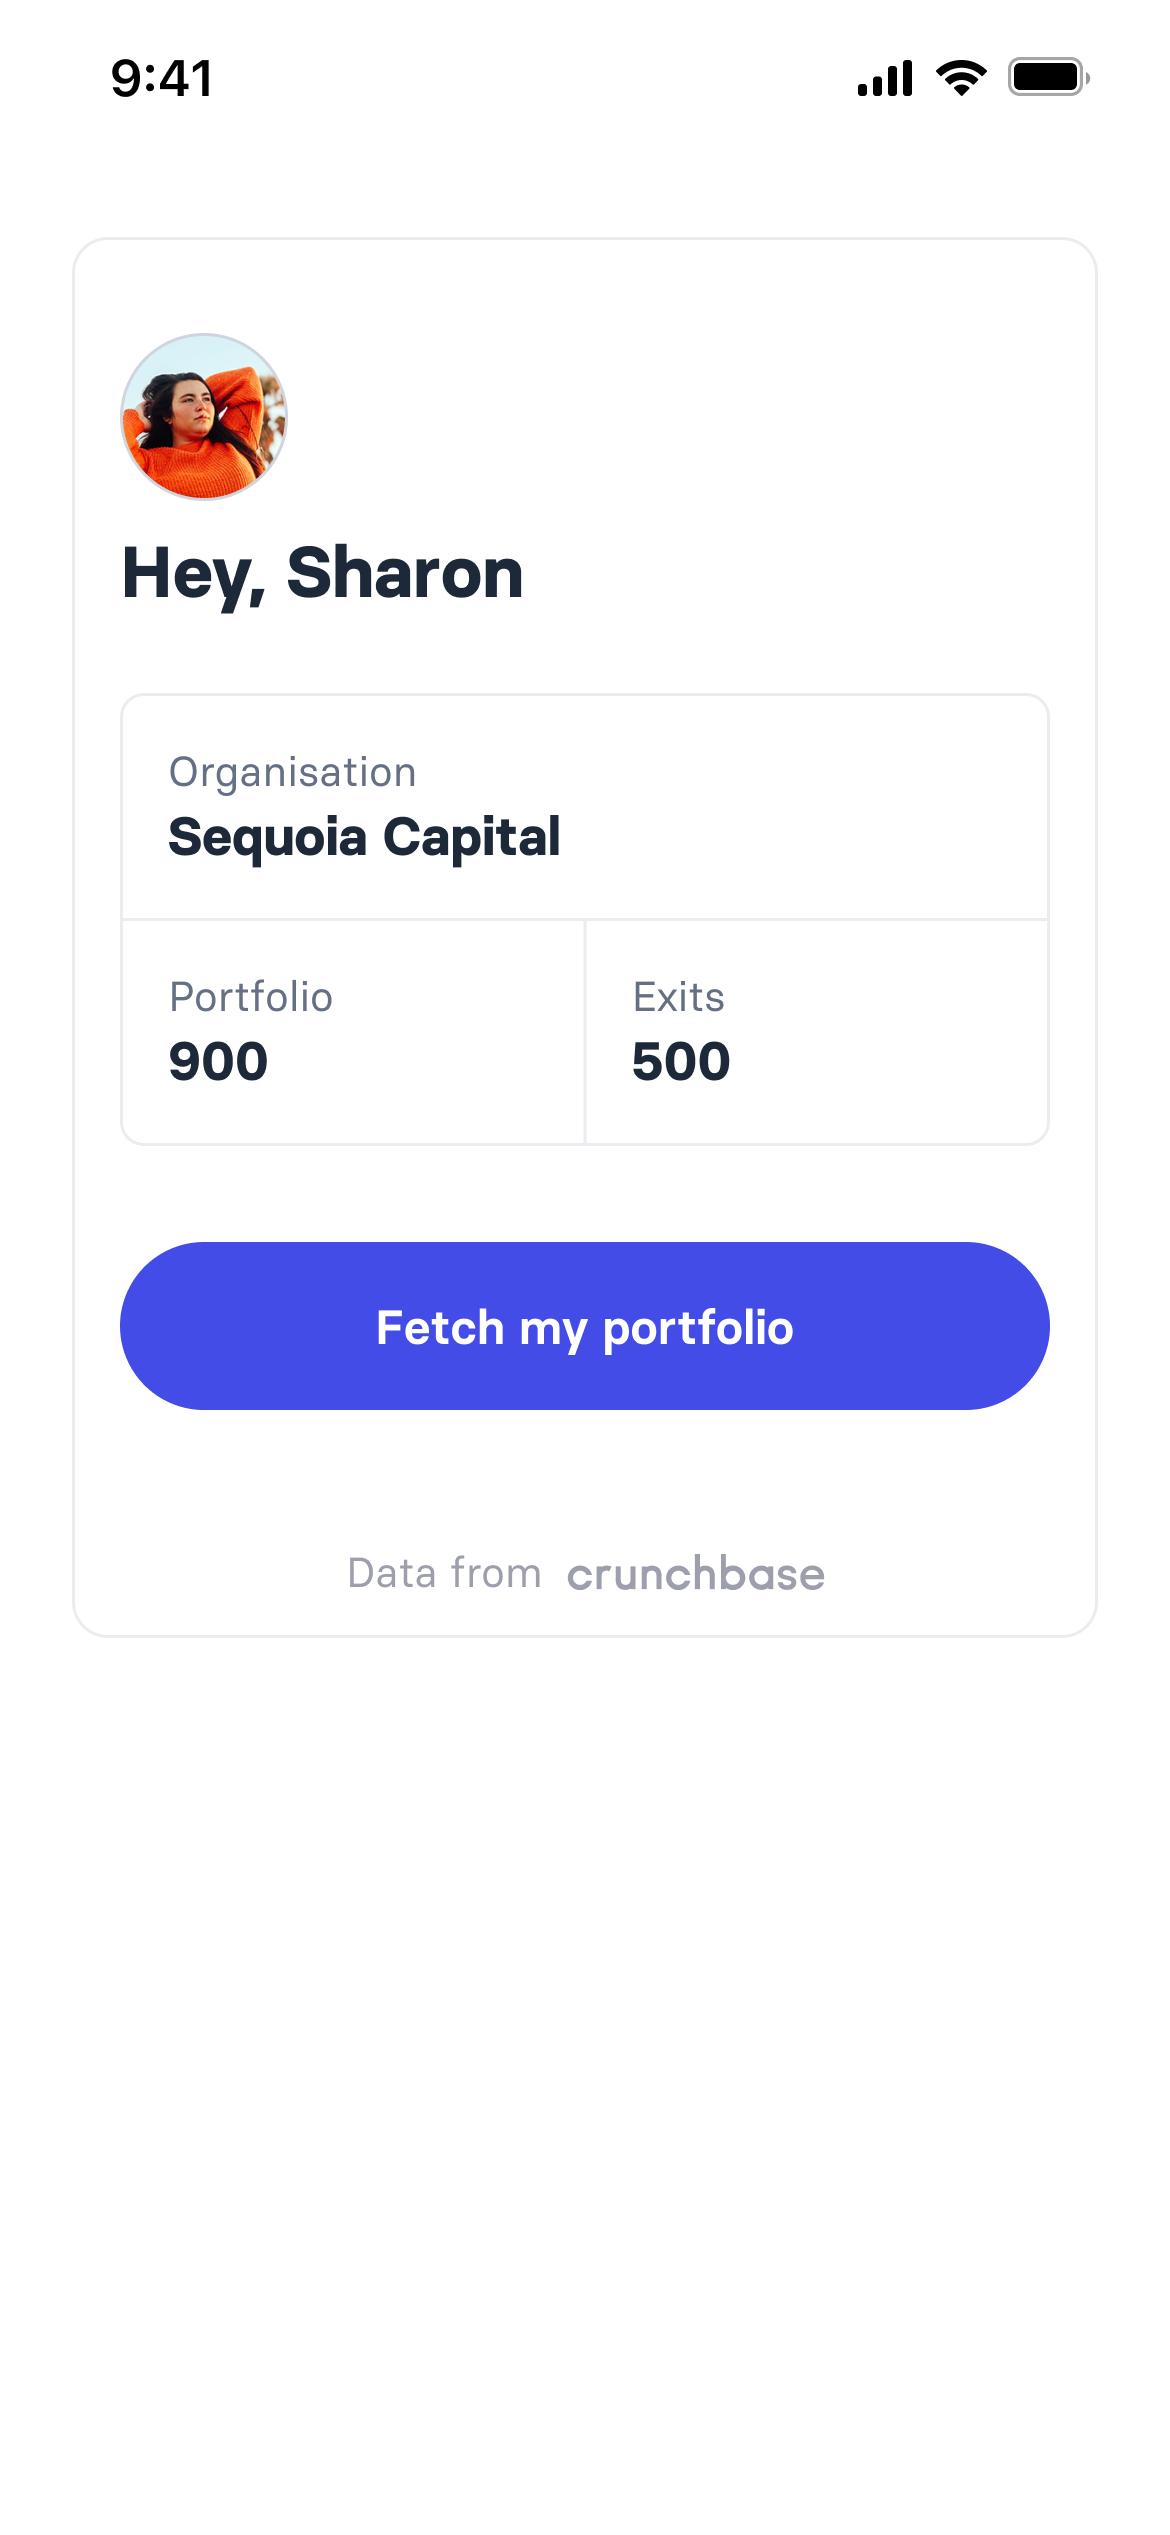
Onboarding step one: a greeting card confirming the user's organisation with its portfolio and exit counts, and a fetch my portfolio action, sourced from Crunchbase
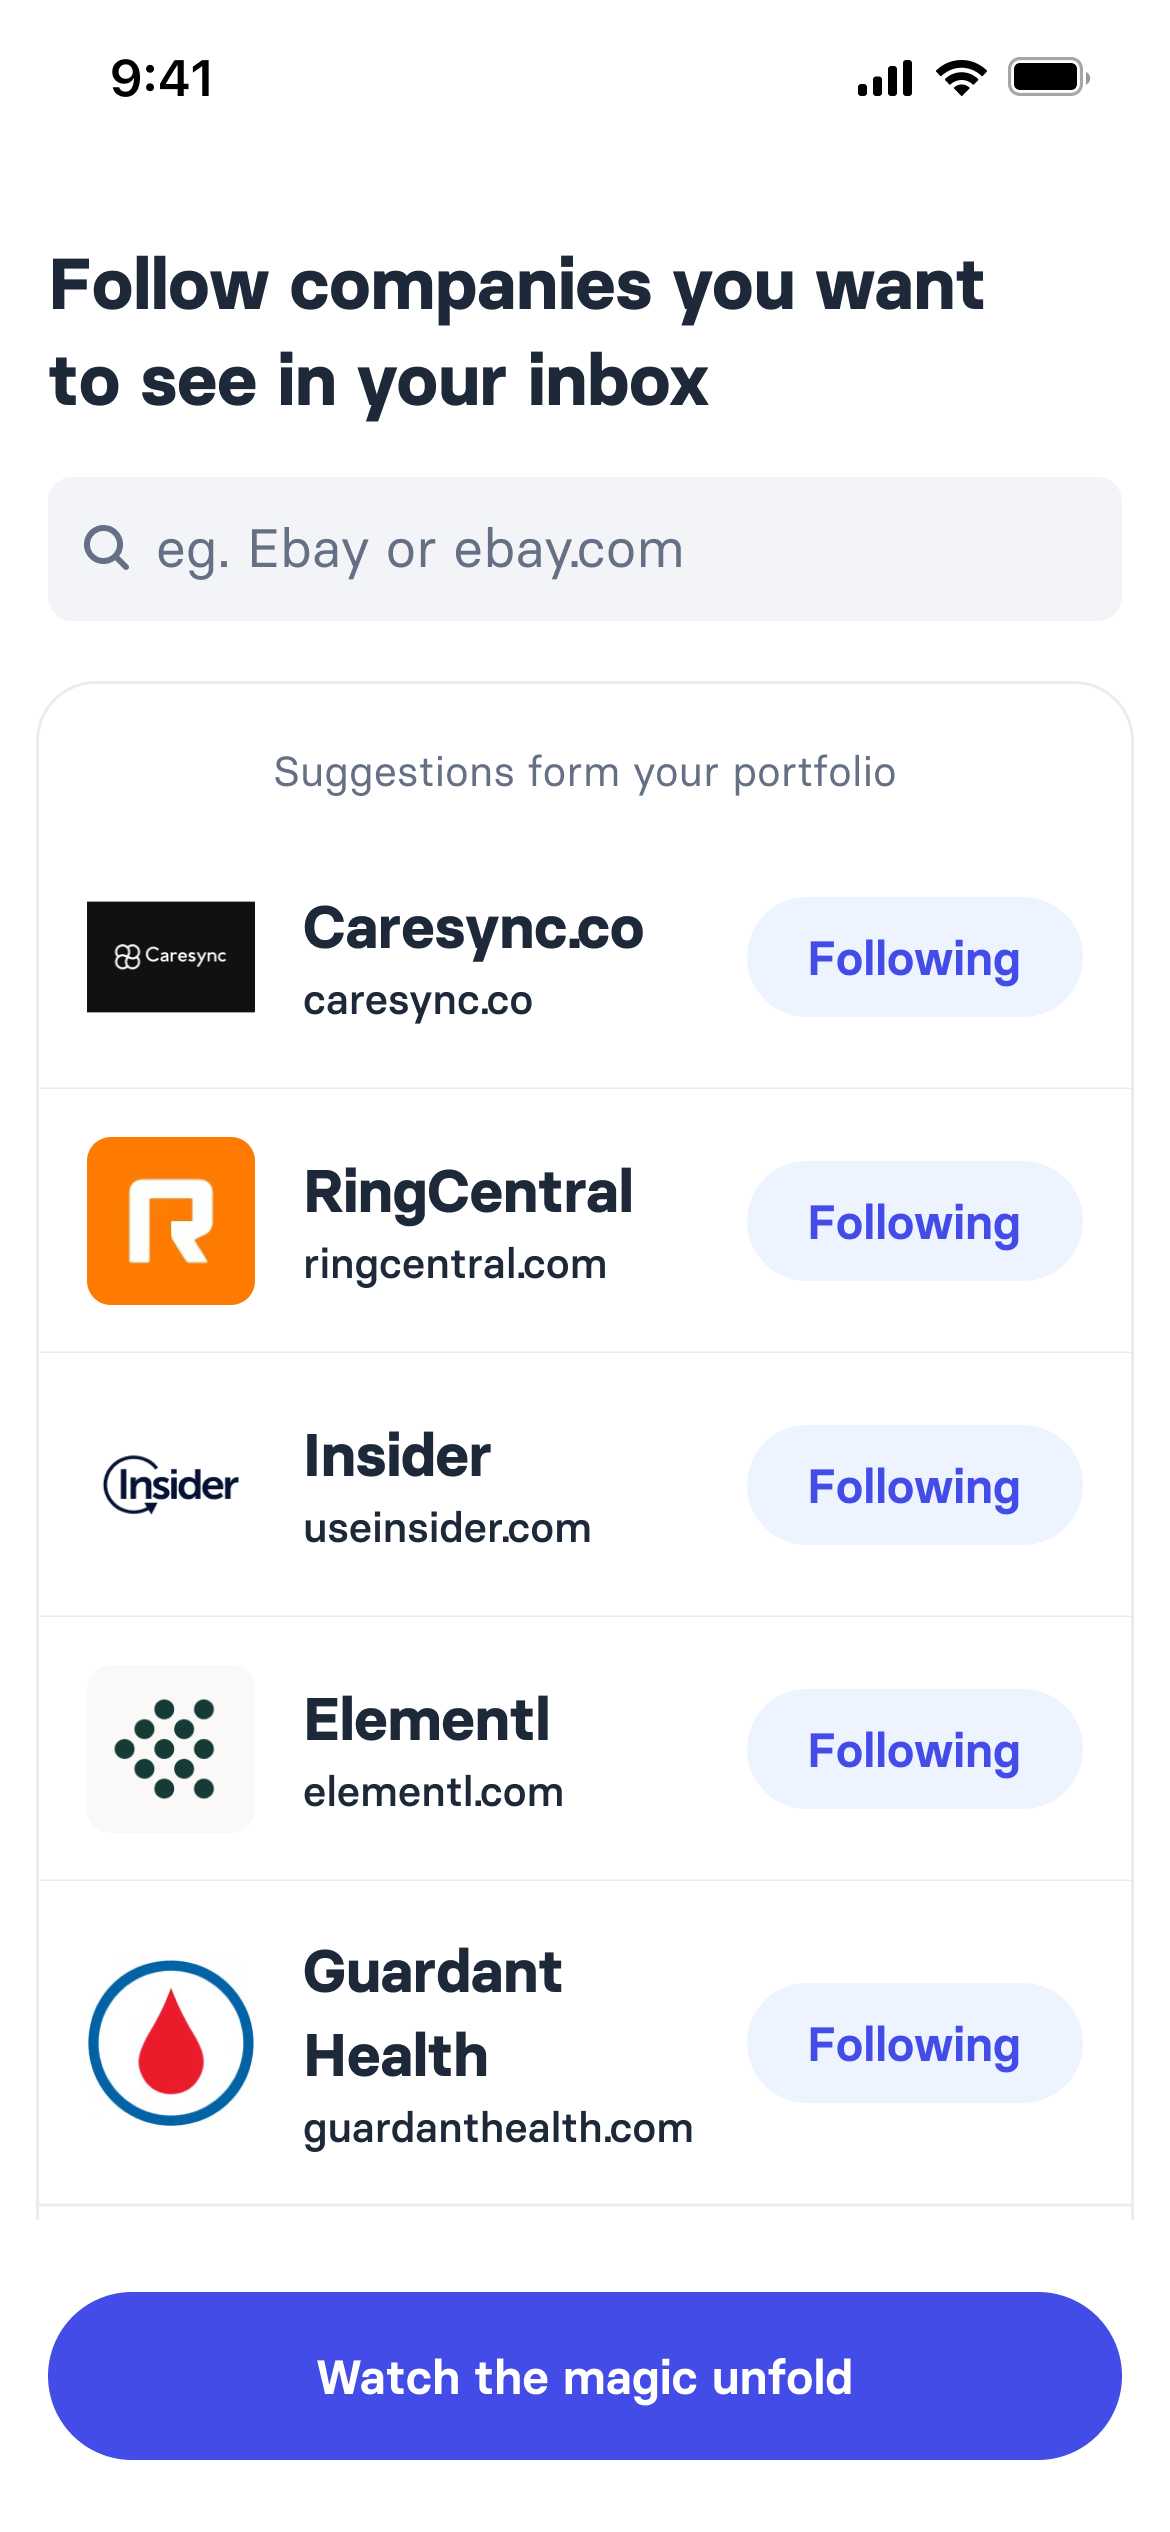
Onboarding step two: follow companies to see in your inbox, with a search field and suggestions drawn from the portfolio, each with a following toggle
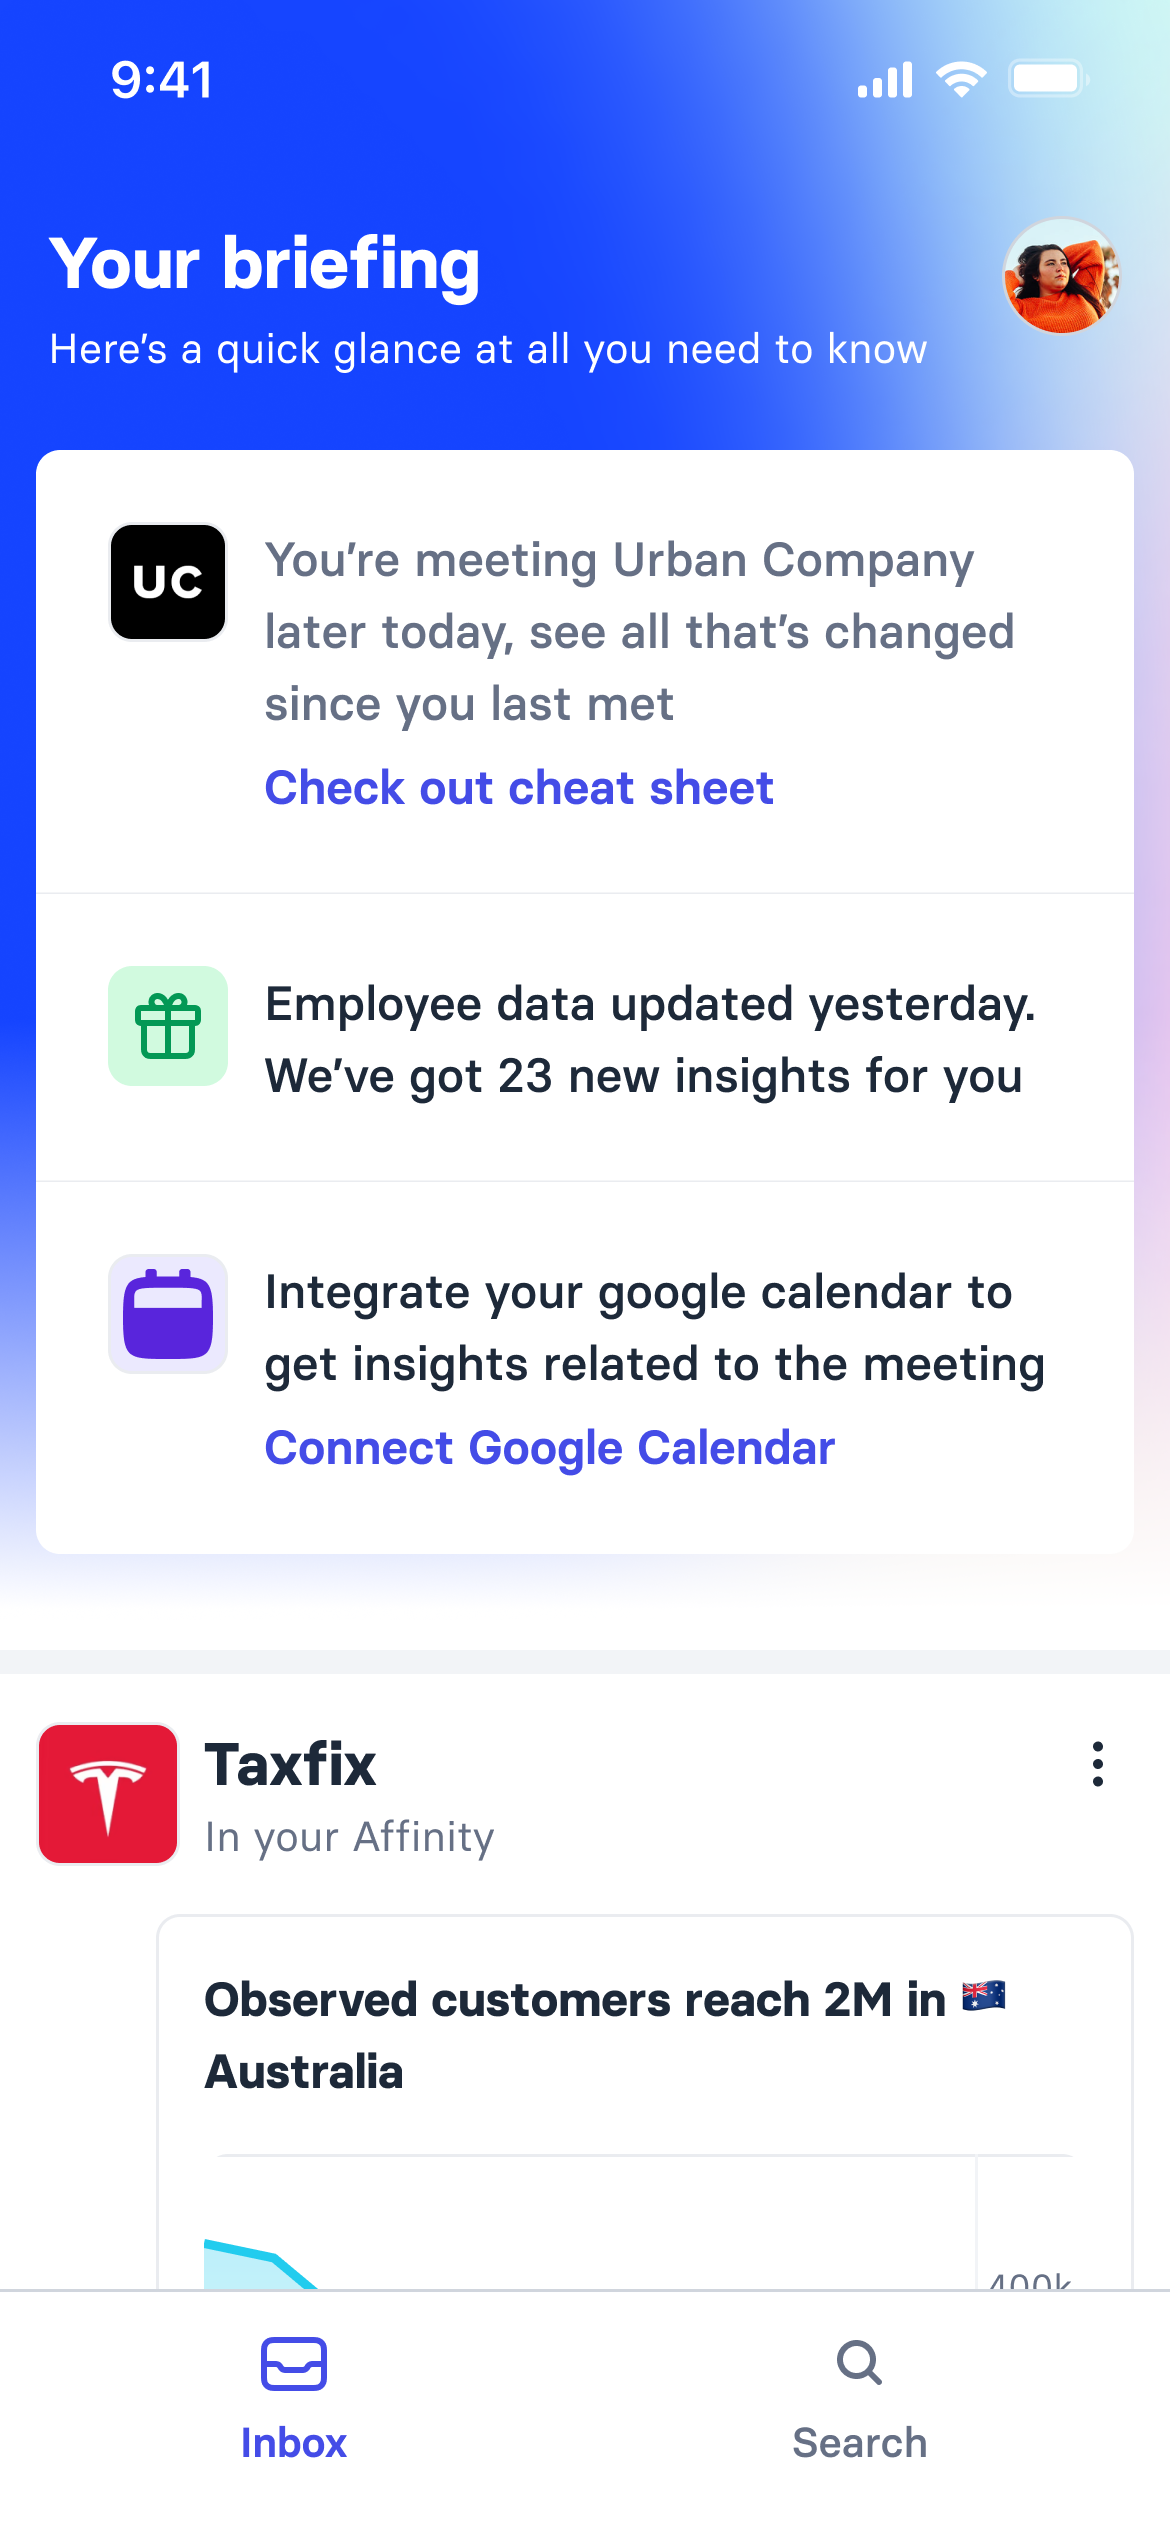
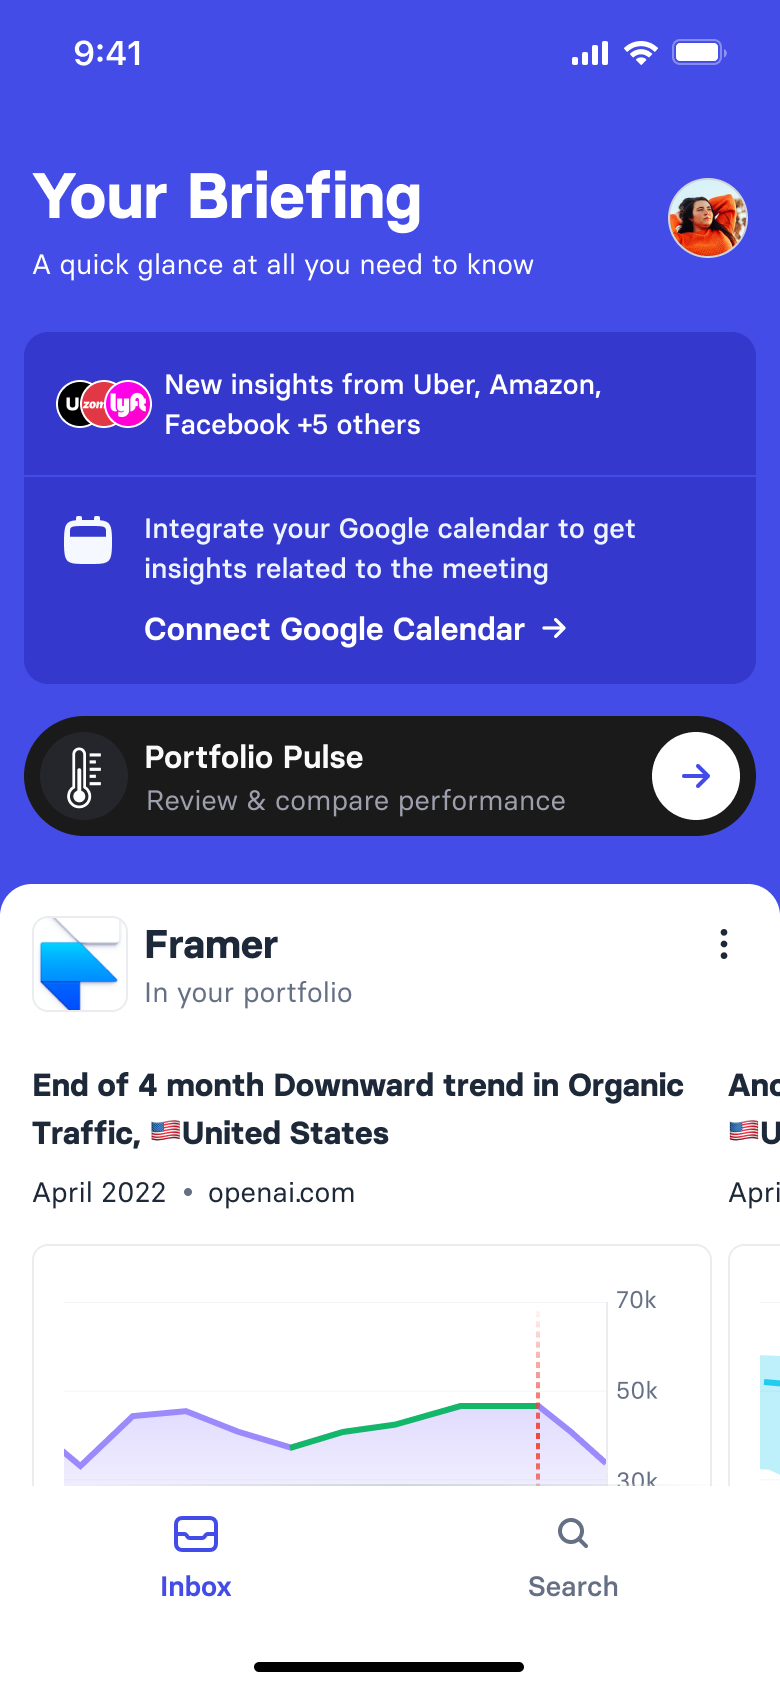
Onboarding complete: the Your briefing home with a meeting prompt linking to the cheat sheet, an employee-data update, a connect Google Calendar prompt, and the first signal card
Login · Onboarding
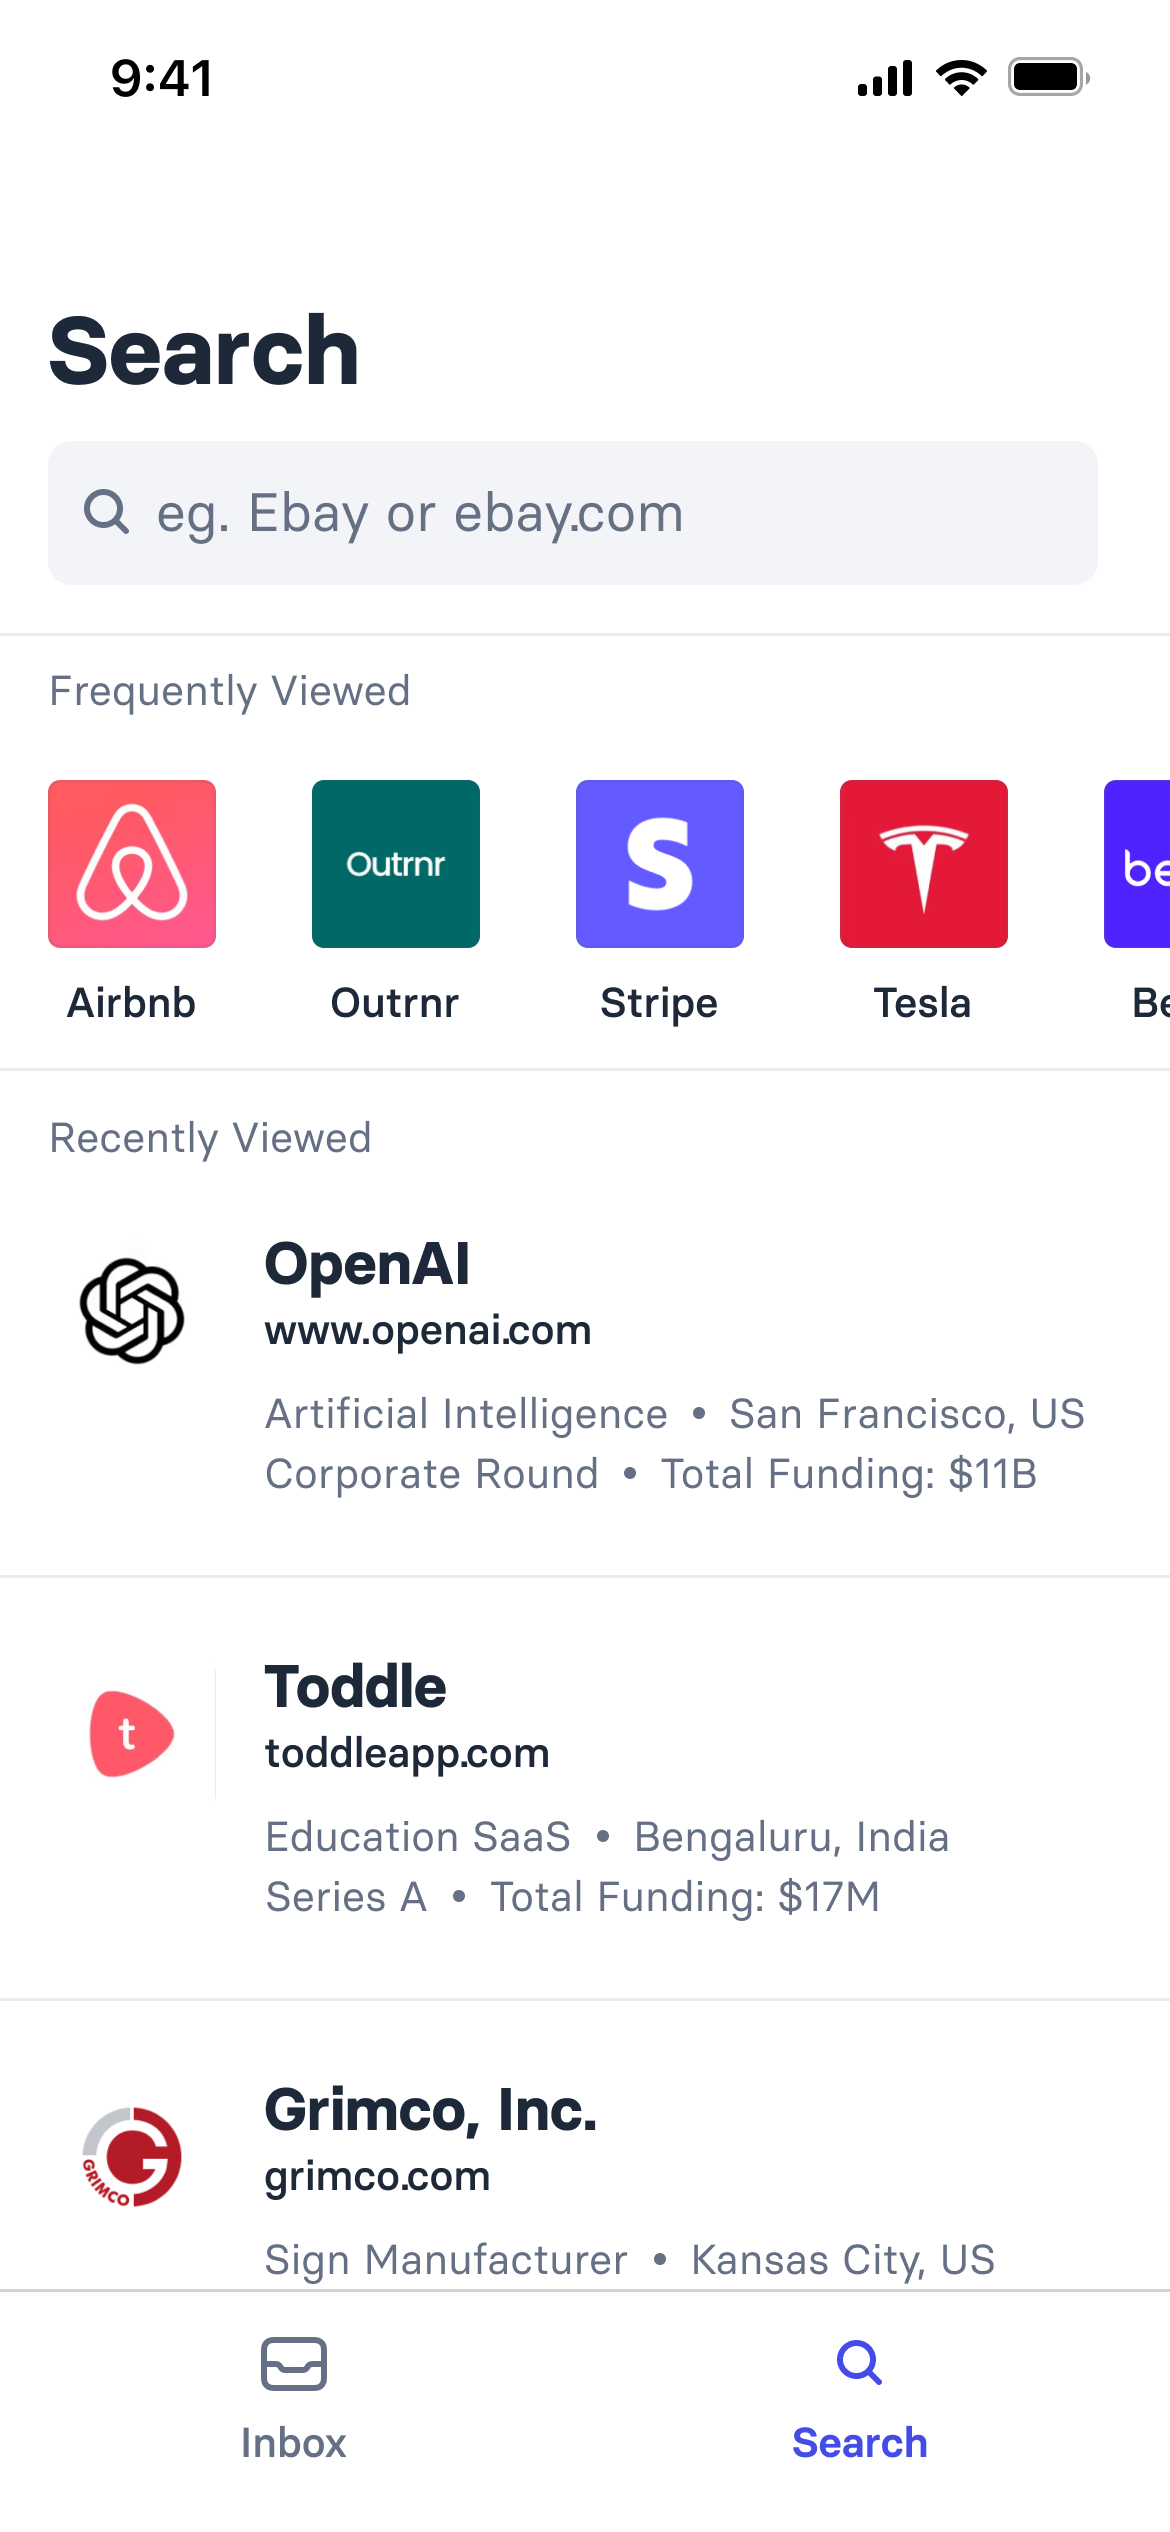
Search home with recently viewed companies and quick access tiles

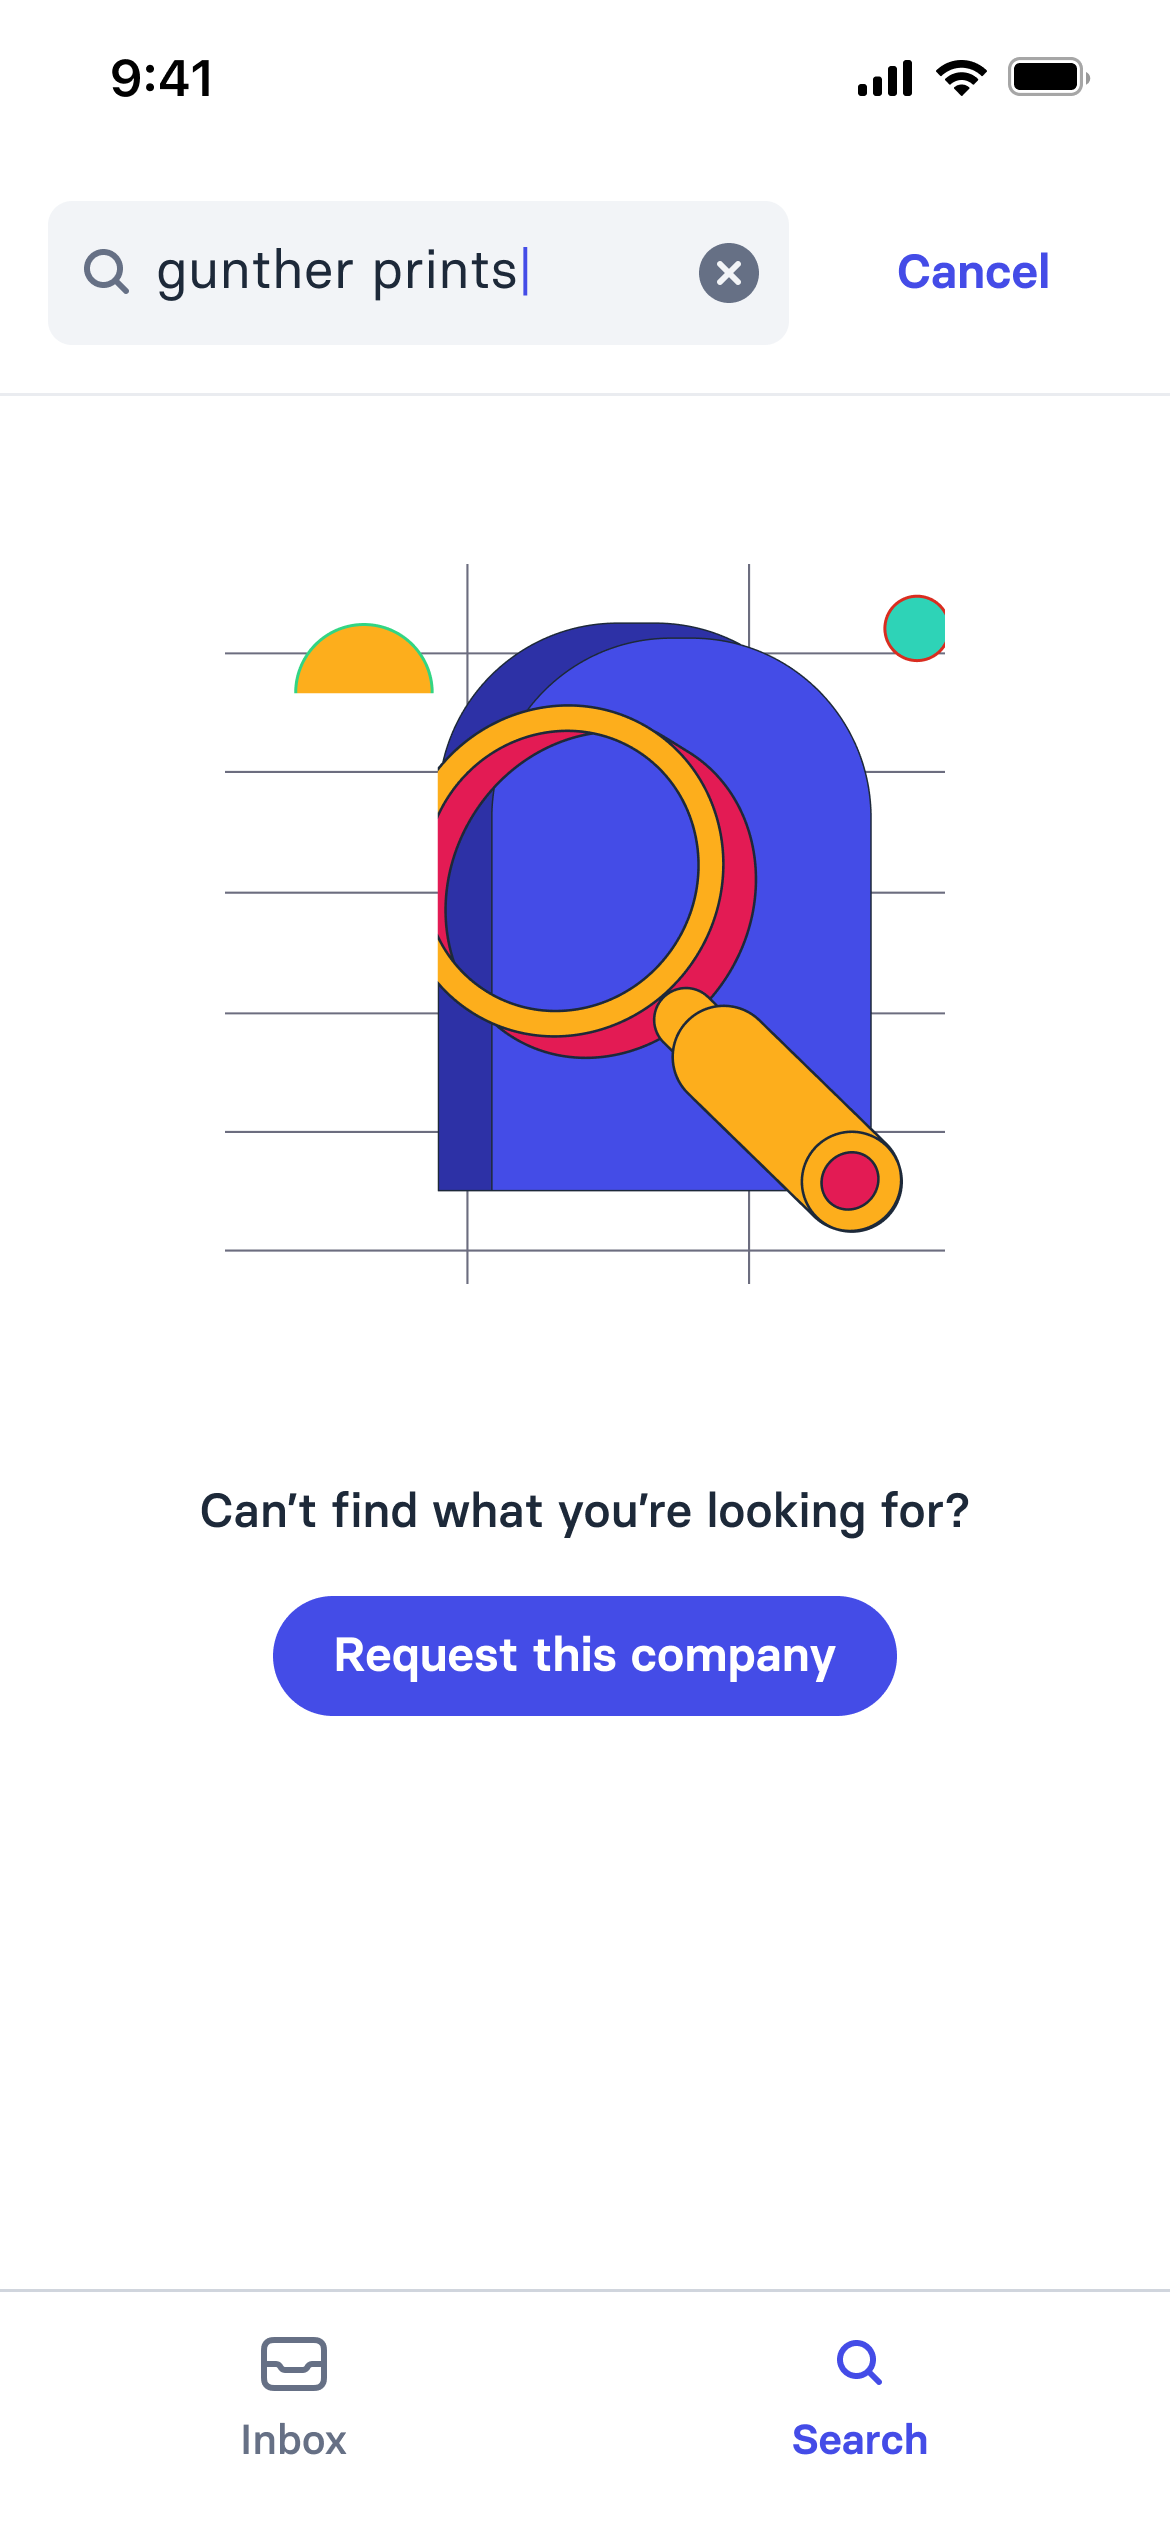
No results for a company search, with an illustration, the line can't find what you're looking for, and a request this company action
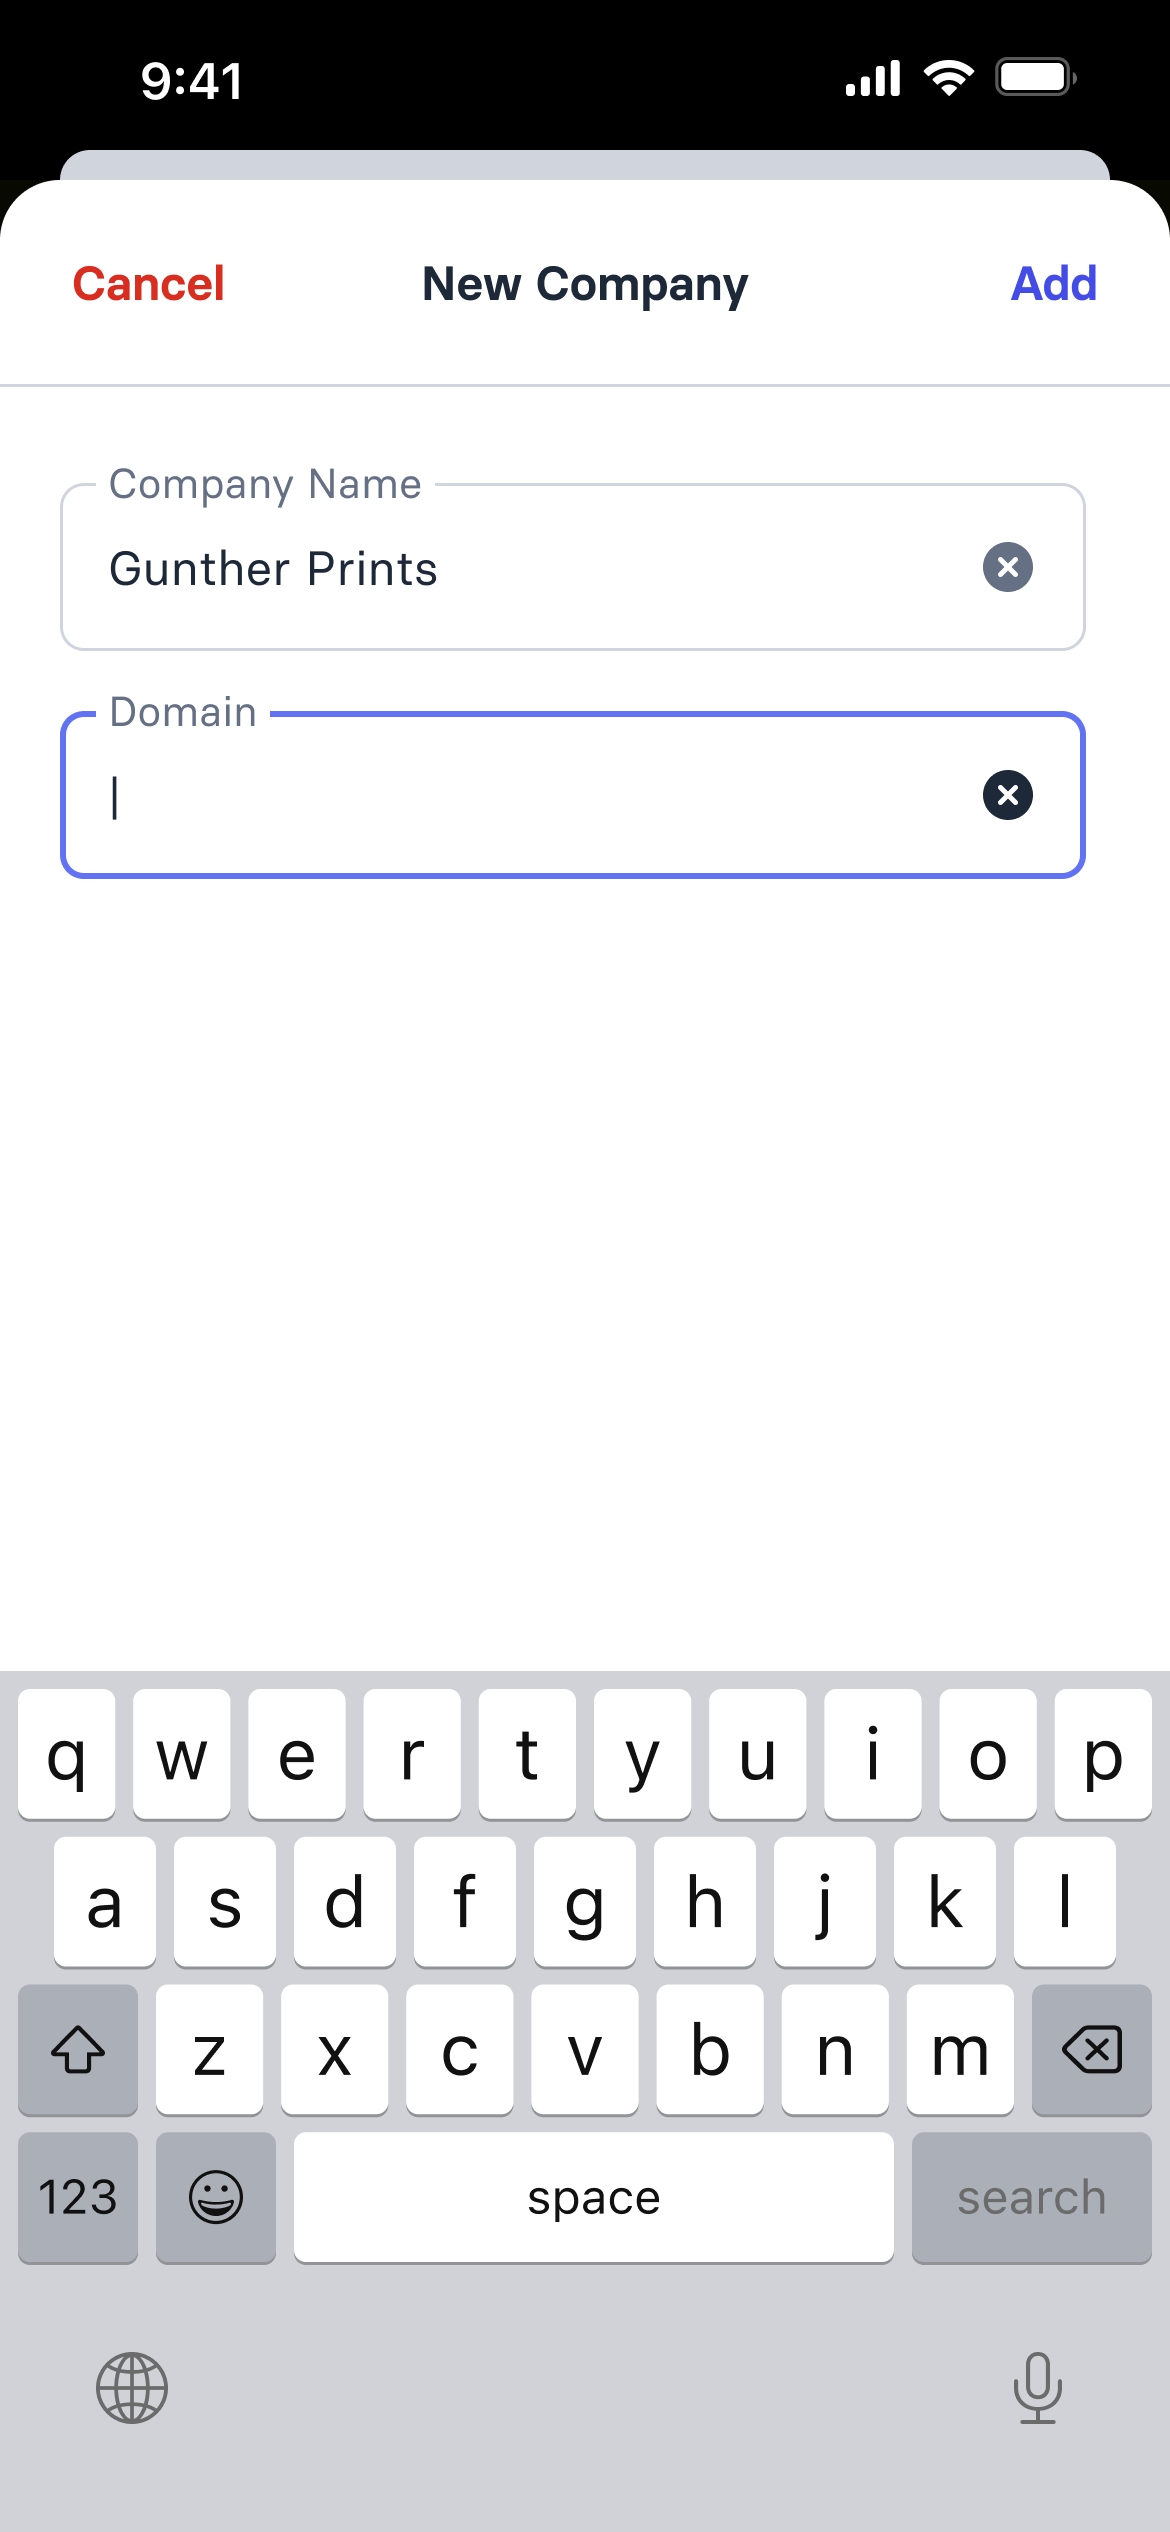
Adding a company from search results
Search
The Your Briefing feed scrolled end to end, showing sentiment, employee-count changes, funding updates and suggested companies
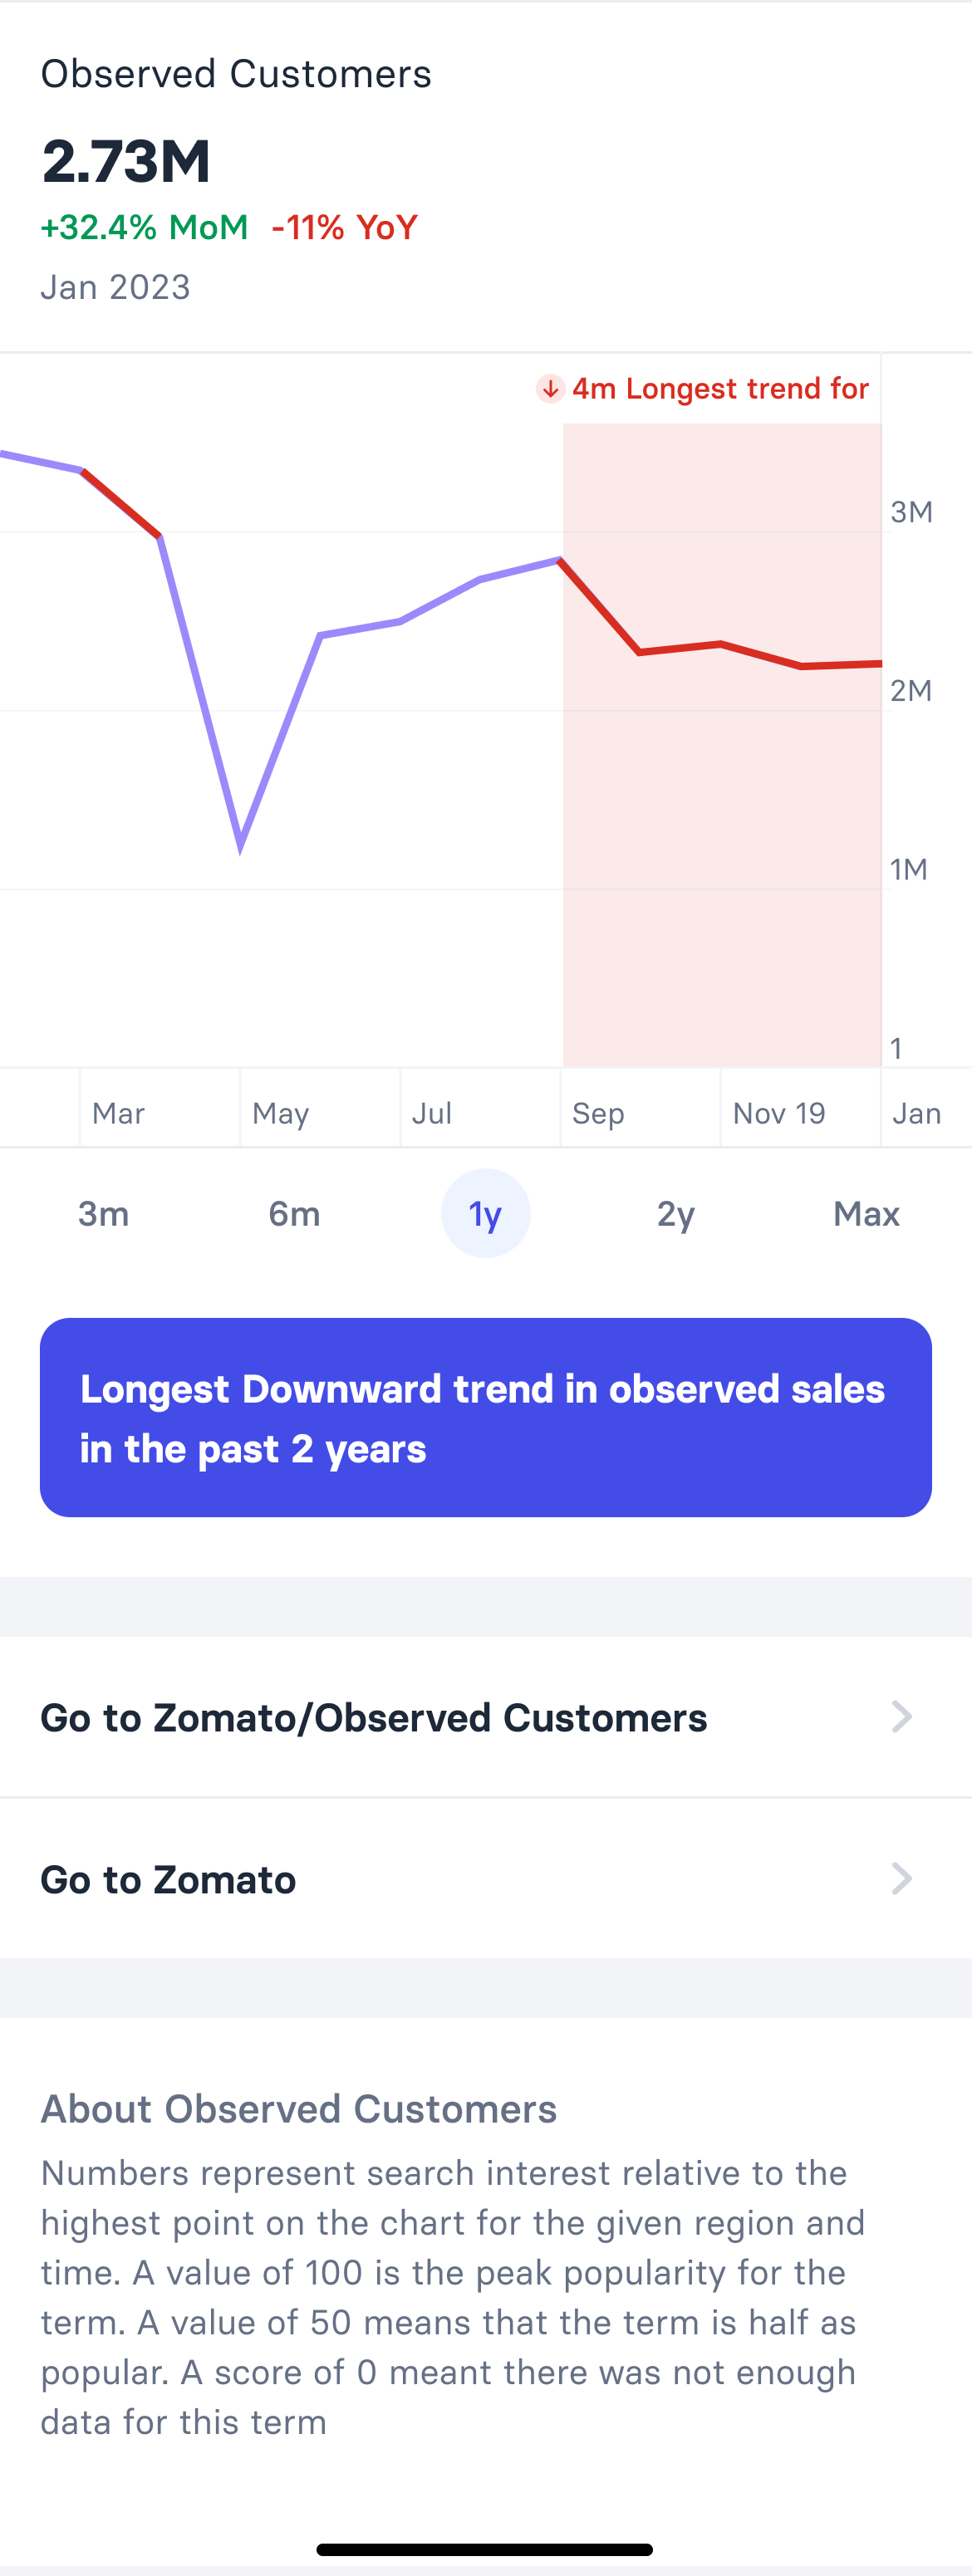
Metric sheet opened from a signal: observed customers for Zomato with month-on-month and year-on-year change, a trend chart with the longest downward run highlighted, range selector, links through to the metric and the company, and an explanation of the metric
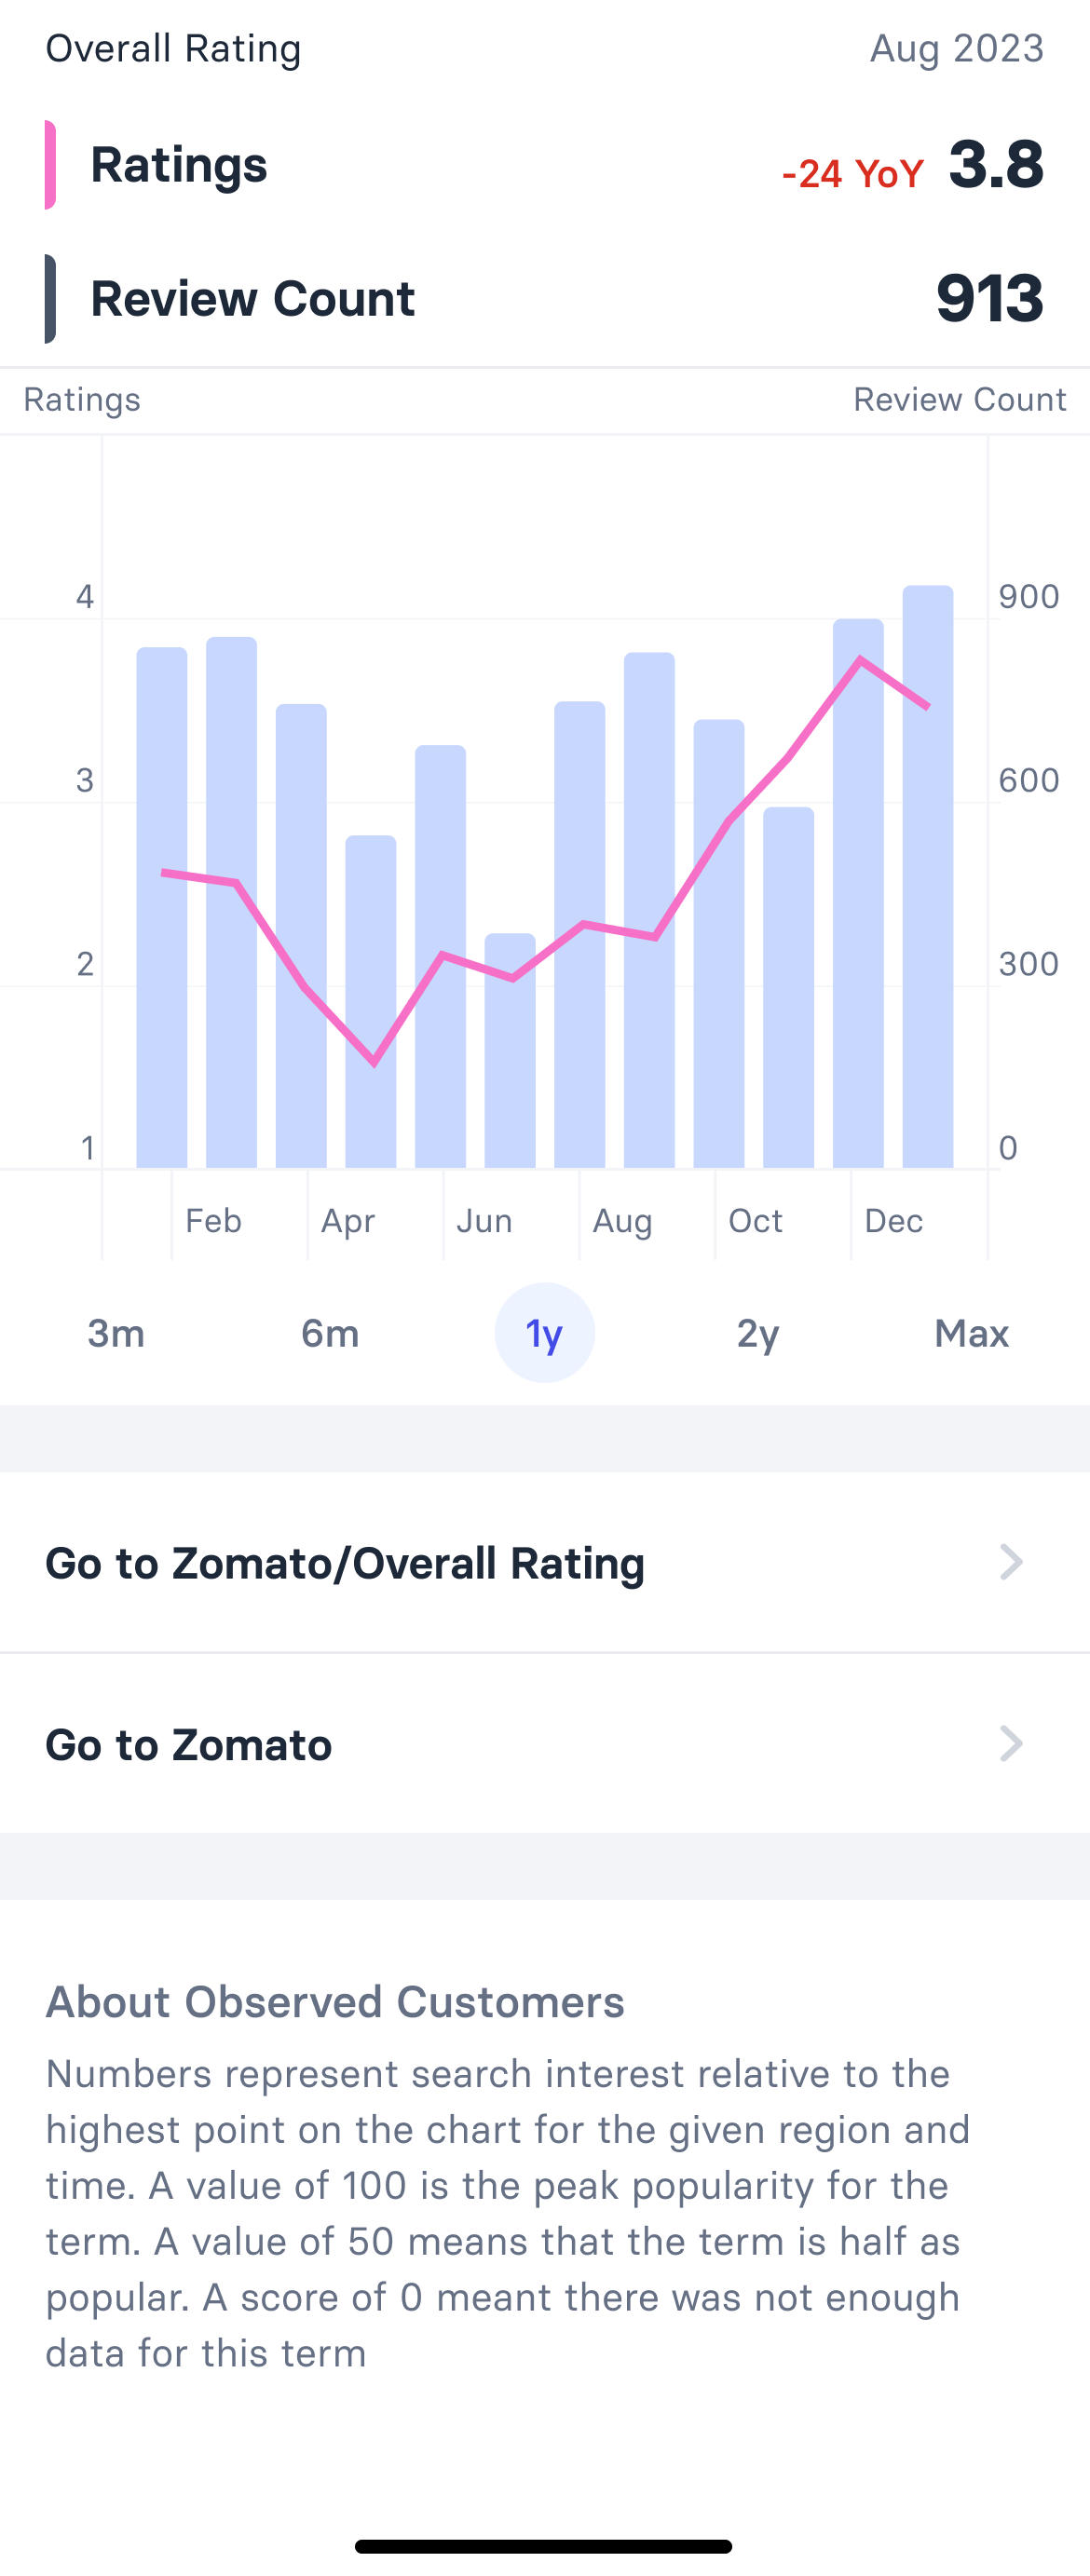
Metric sheet for overall rating: rating and review count with year-on-year change, a combined bar and line chart over a year, range selector, and links through to the metric and the company
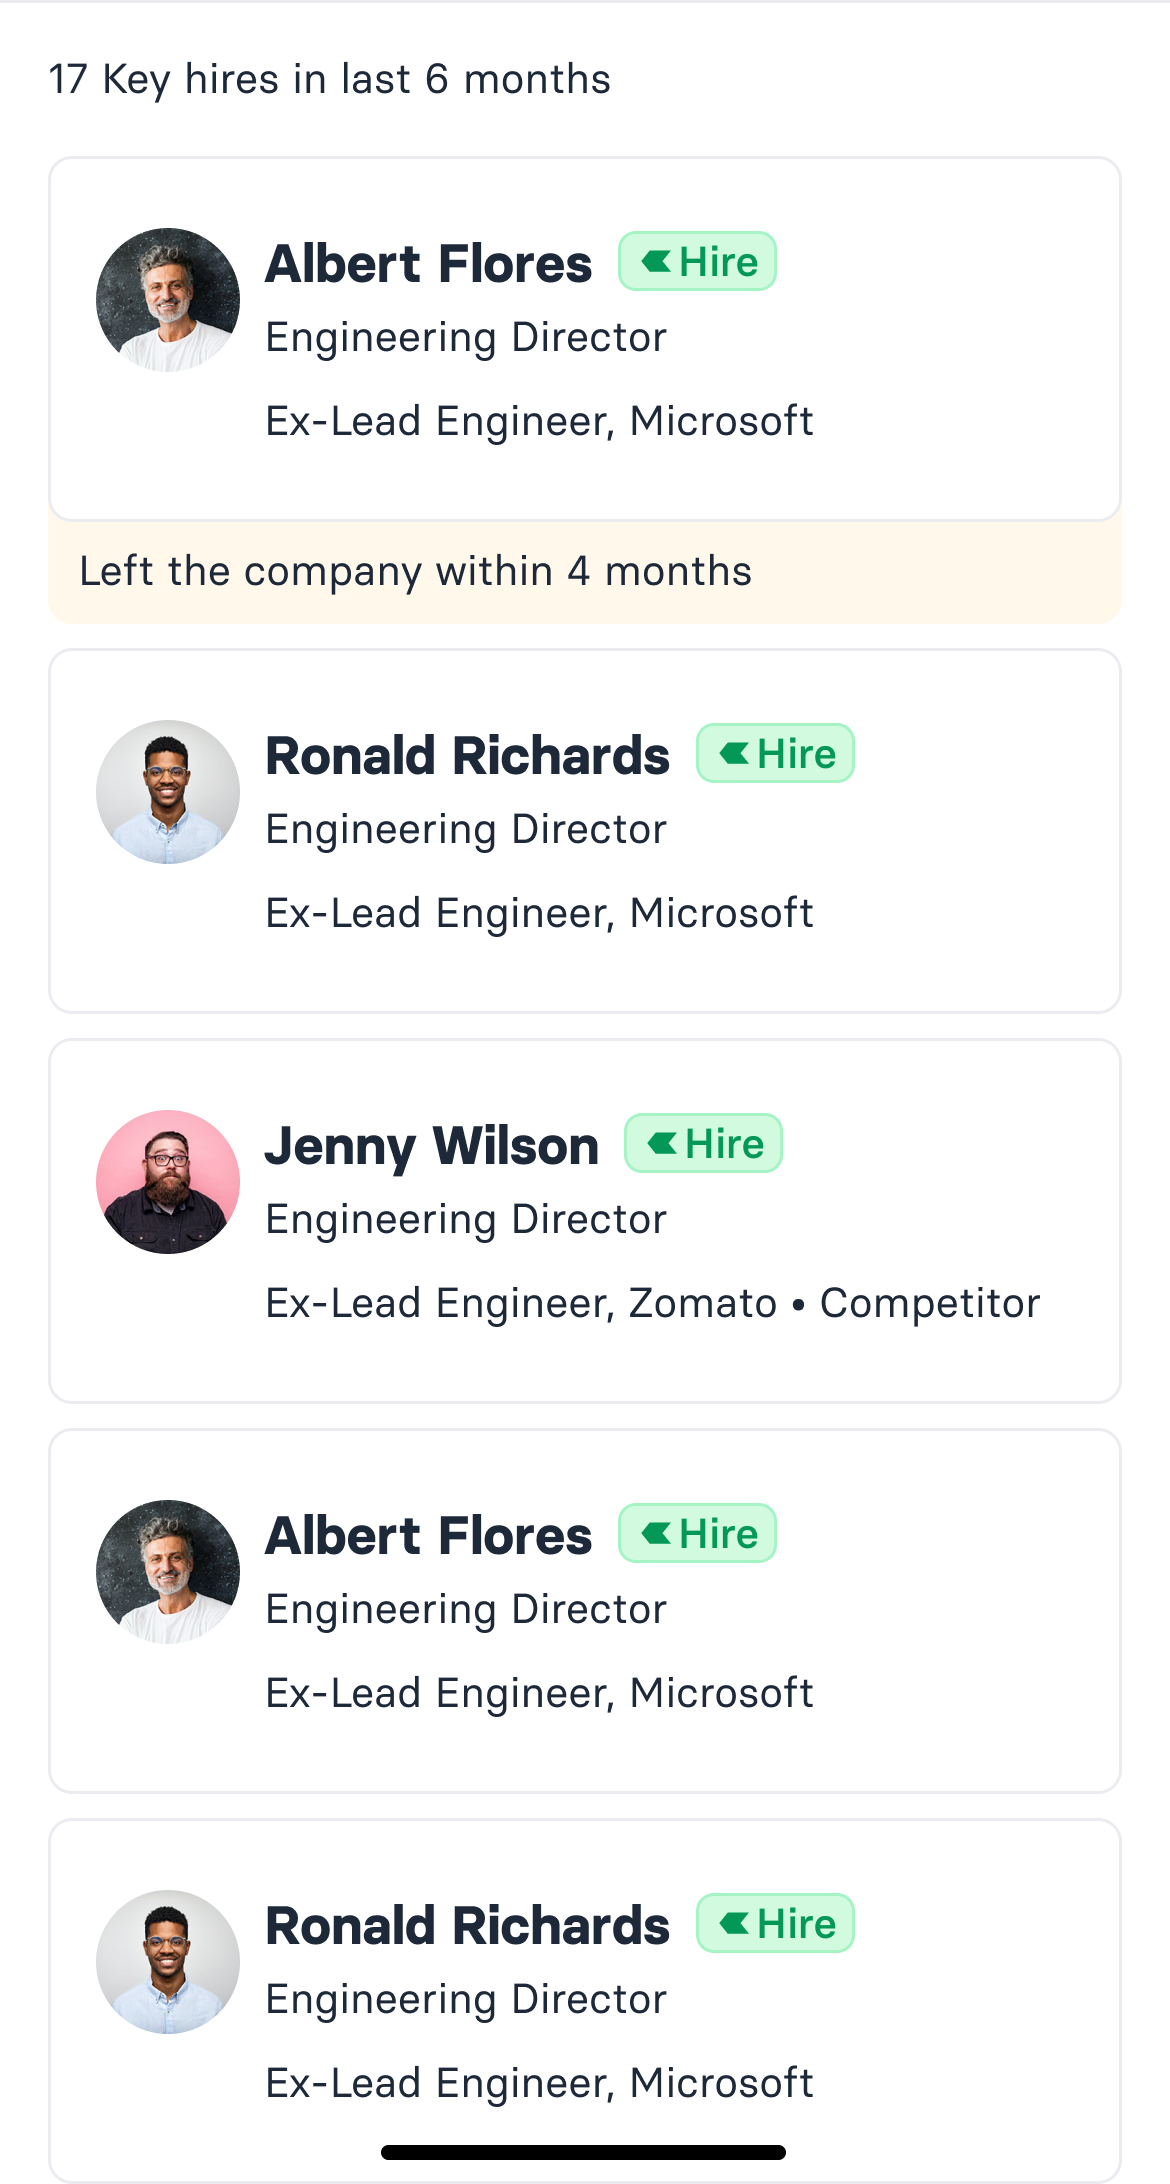
Key hires sheet for Taxfix: seventeen hires in the last six months, each with photo, title and previous employer, flagged where someone left within four months or came from a competitor
Inbox & signals
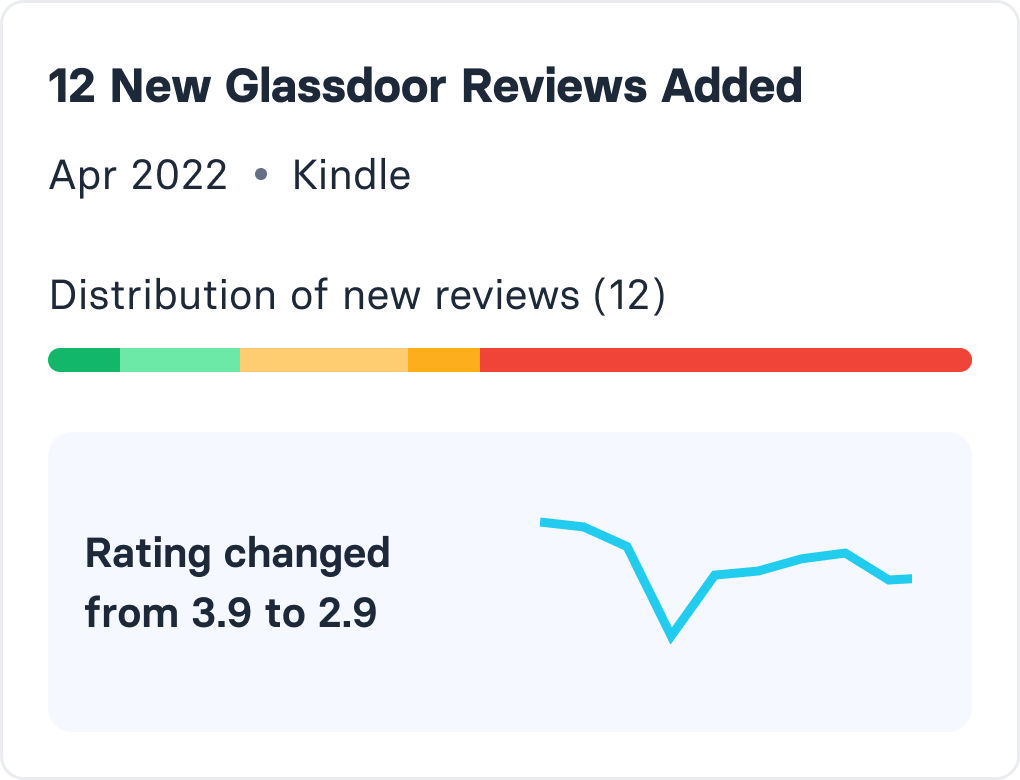
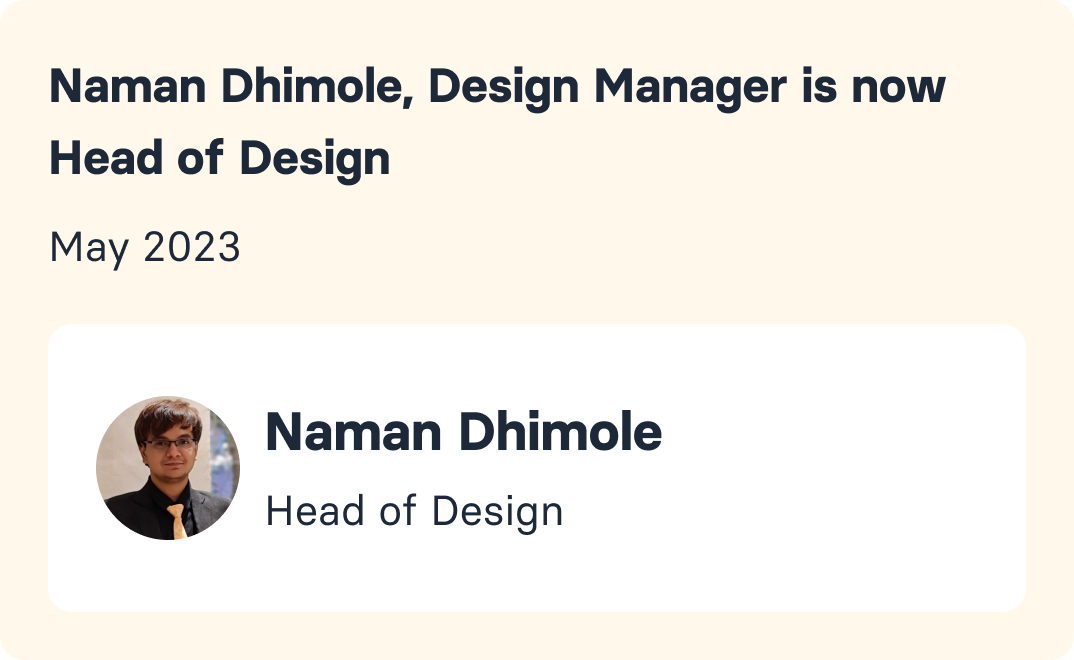
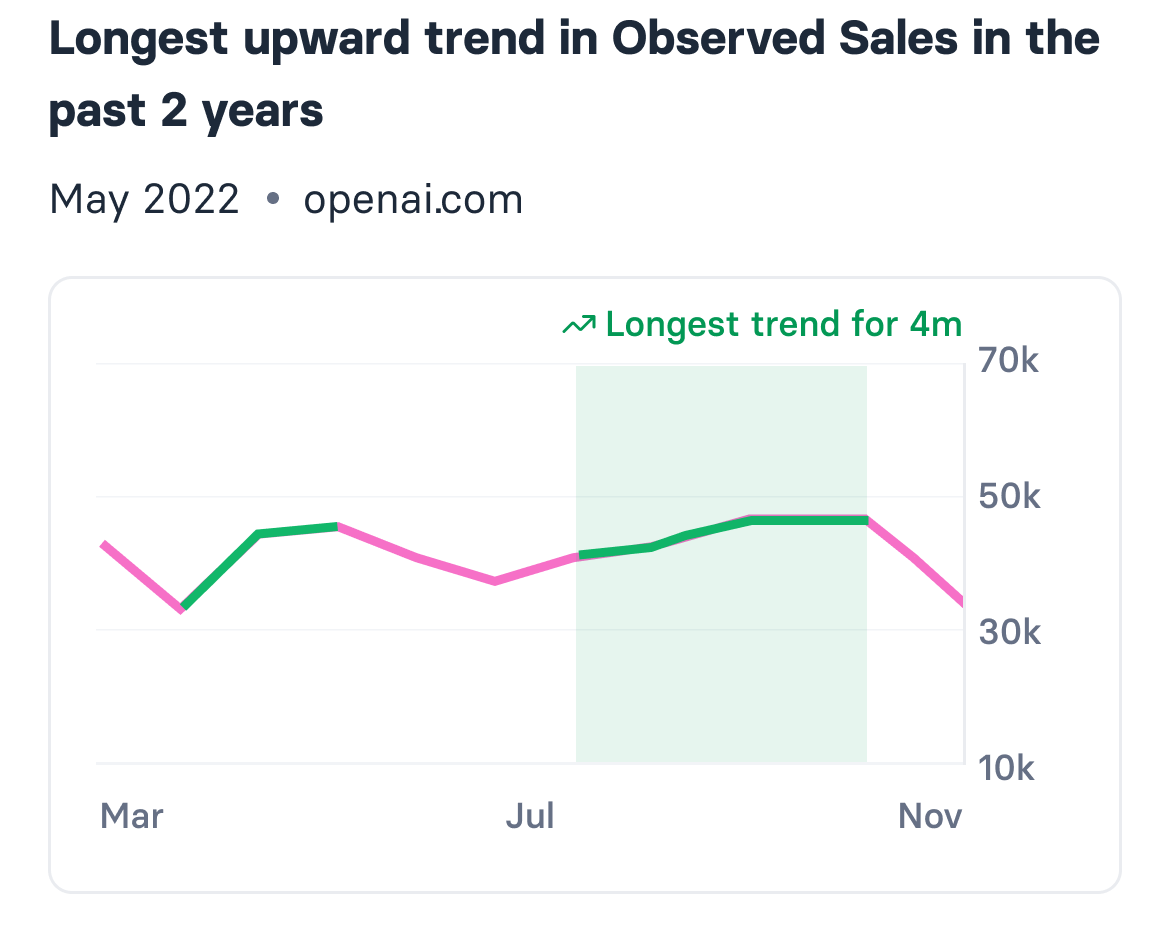
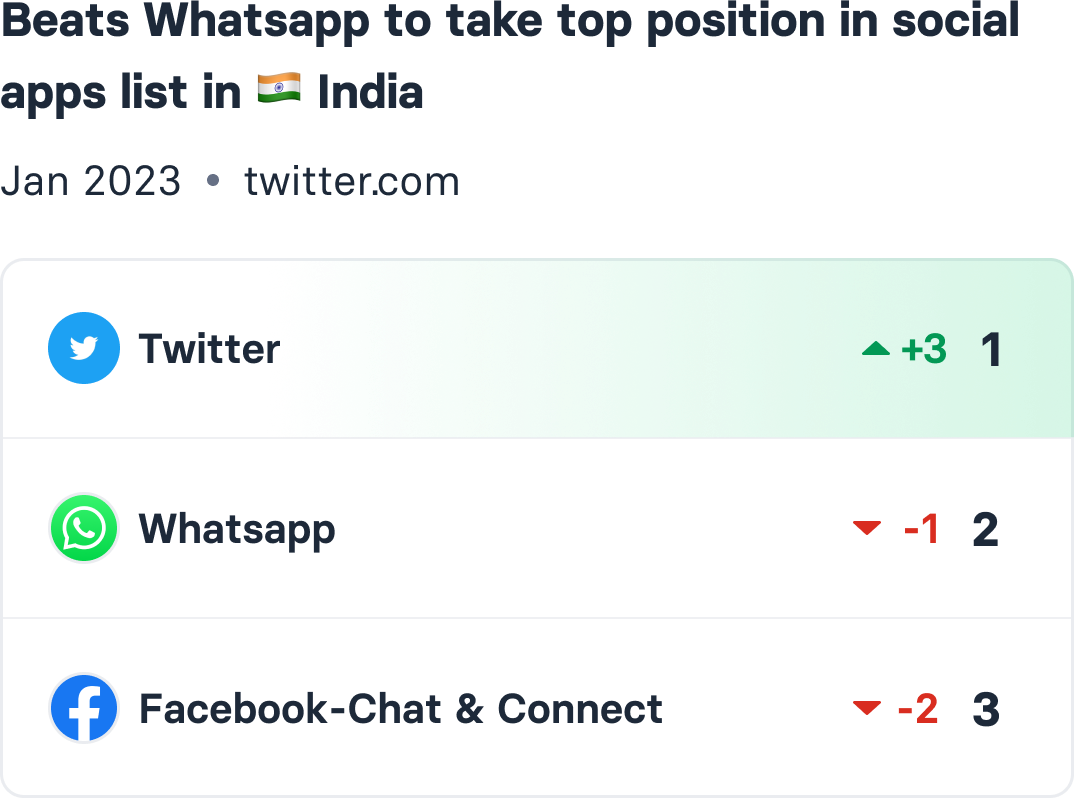
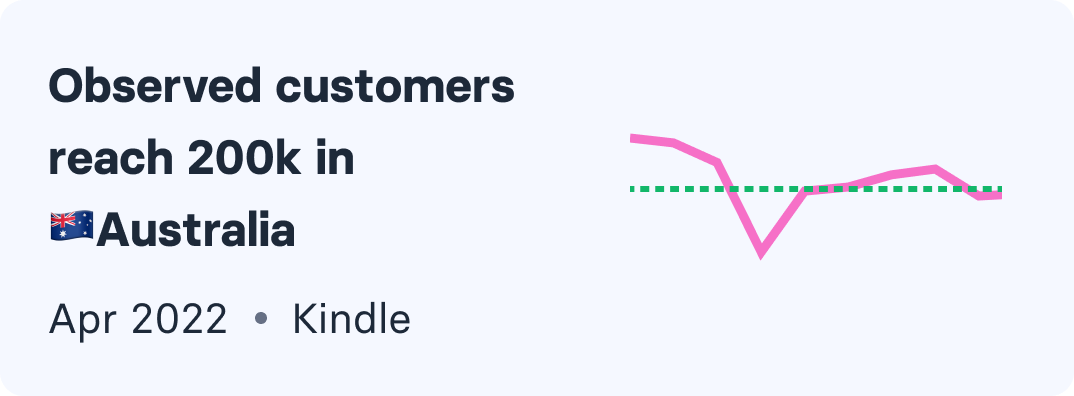
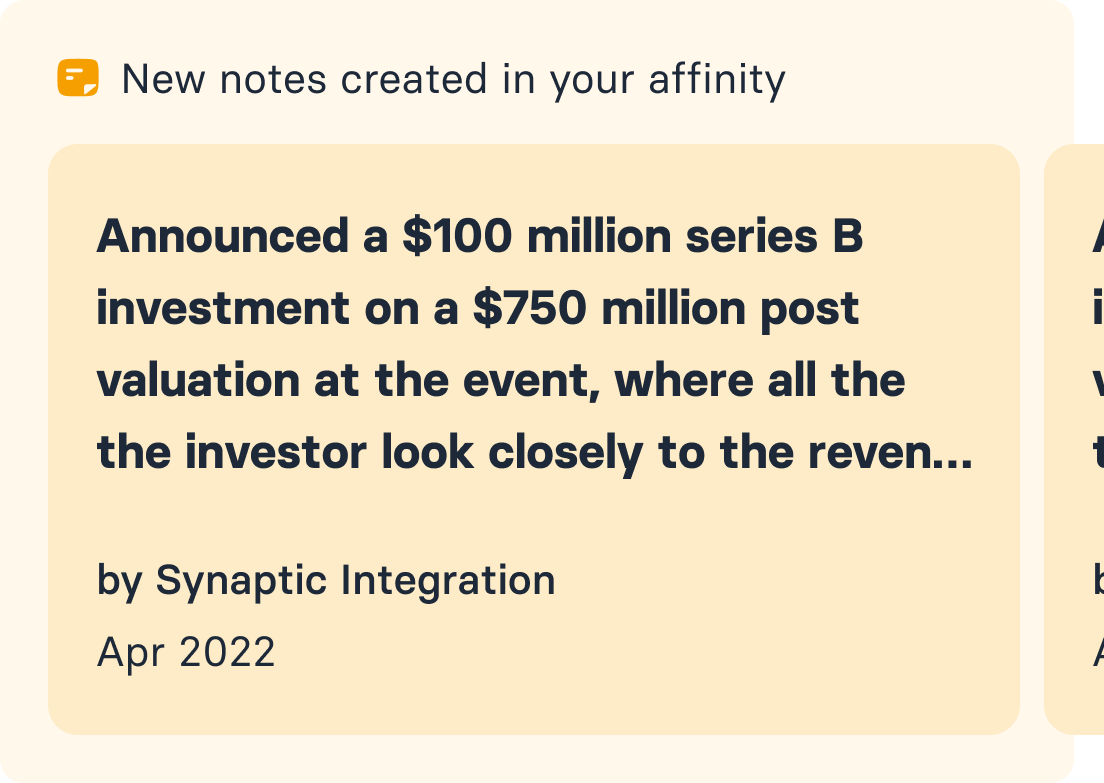
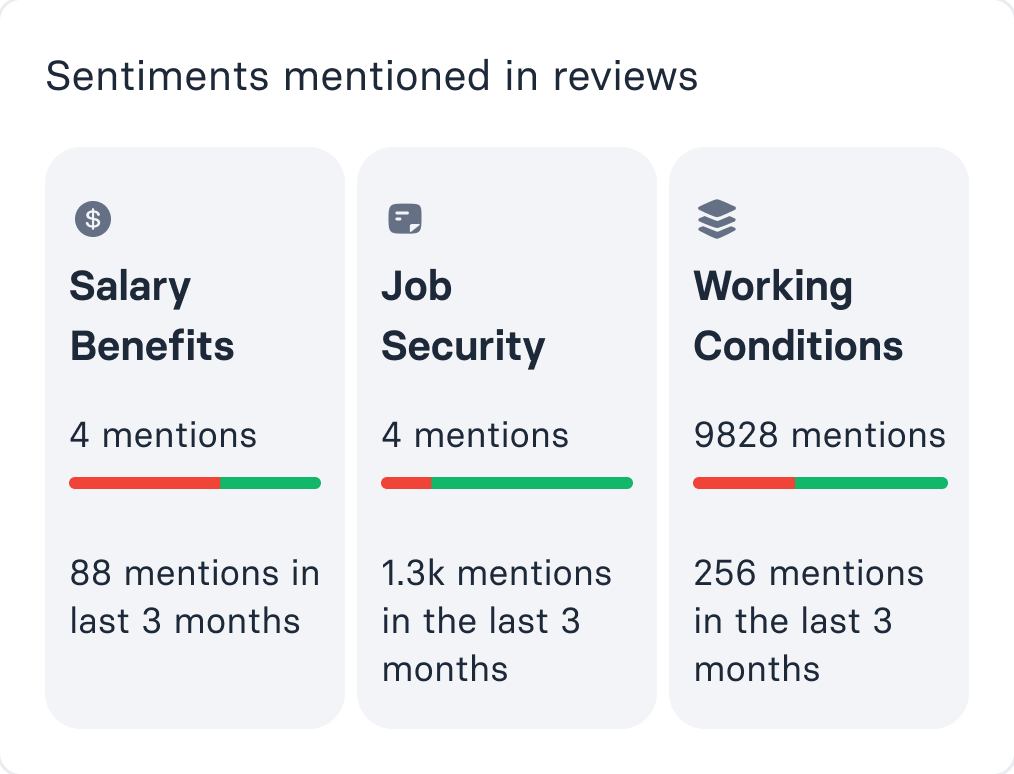
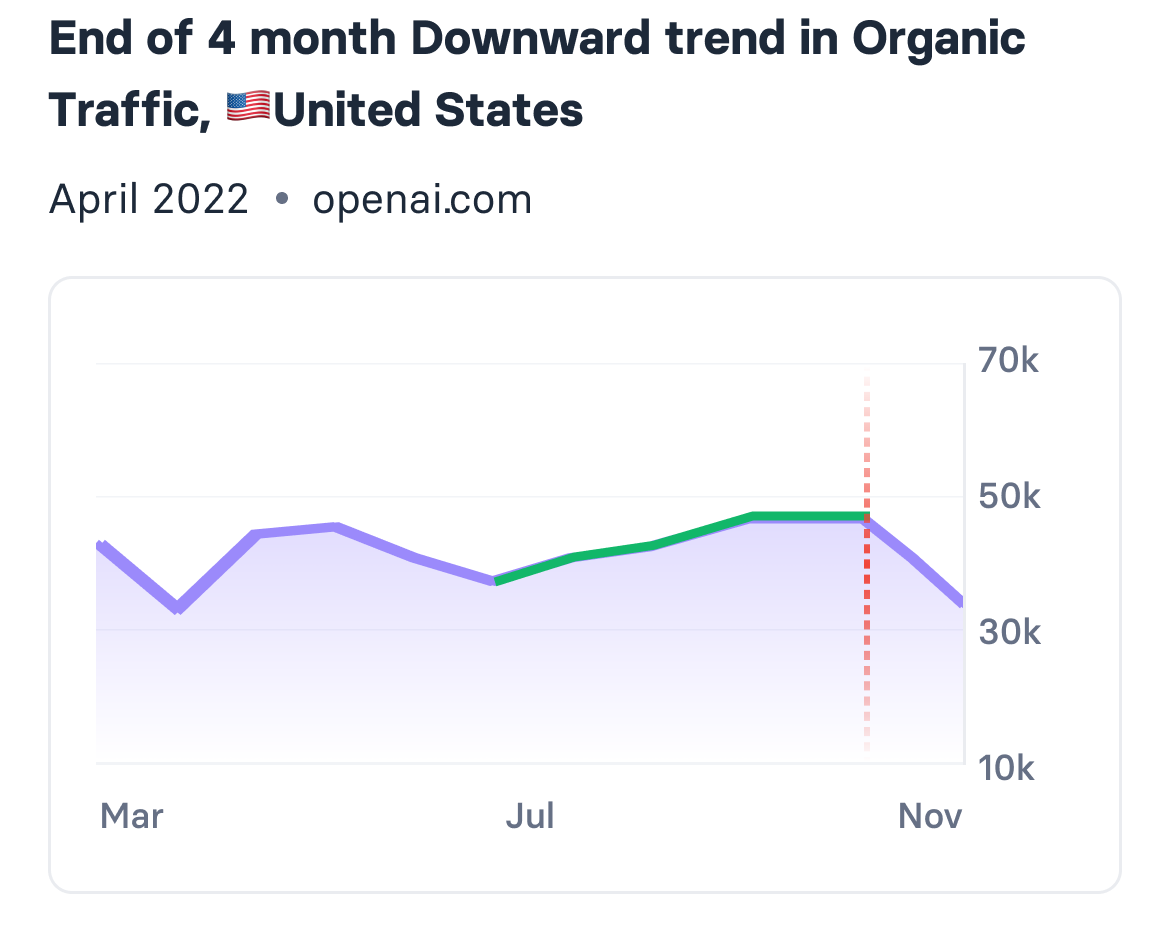
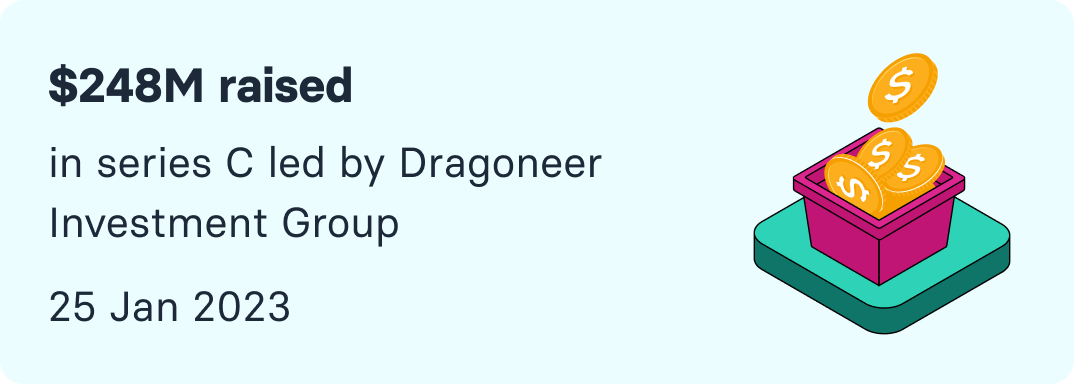
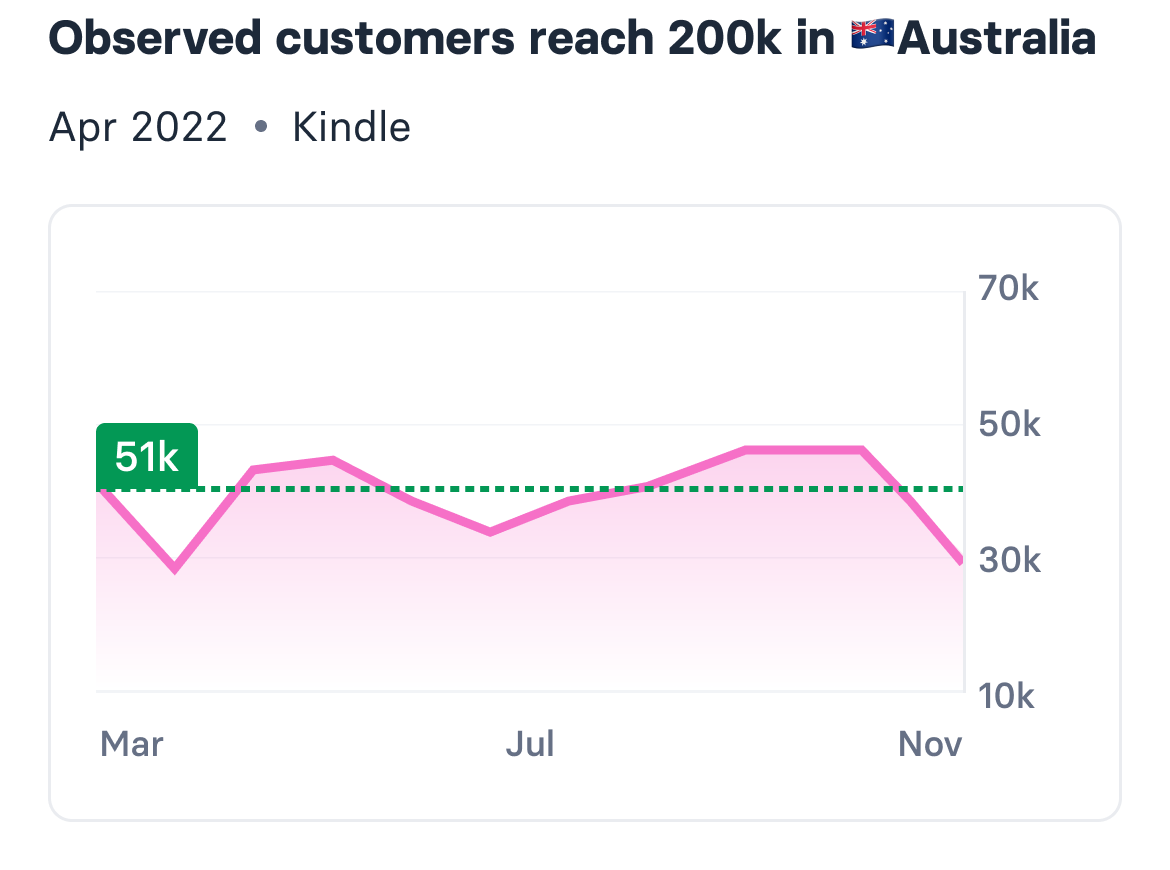
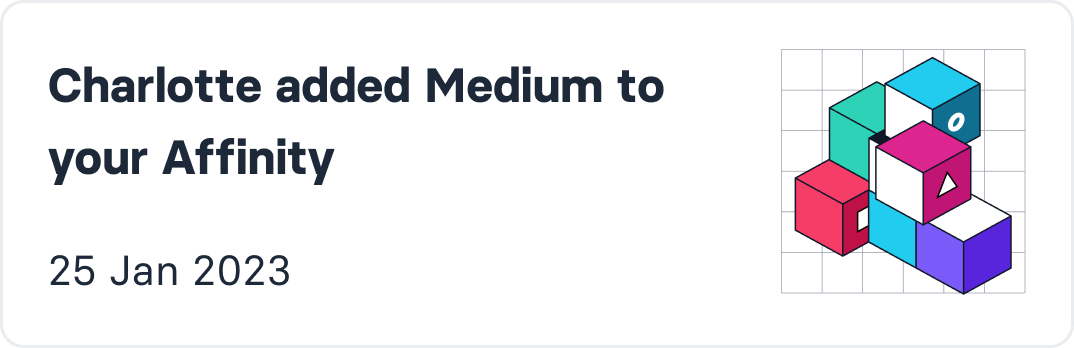
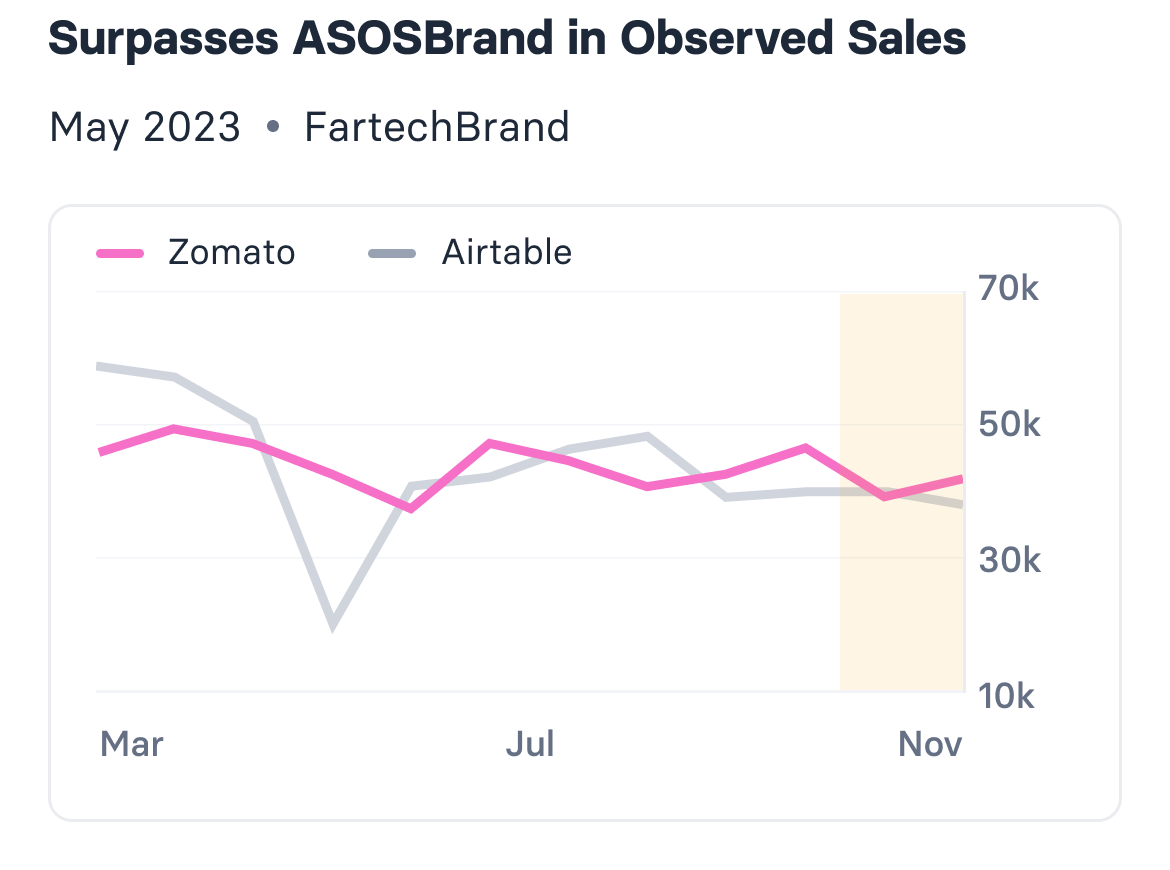
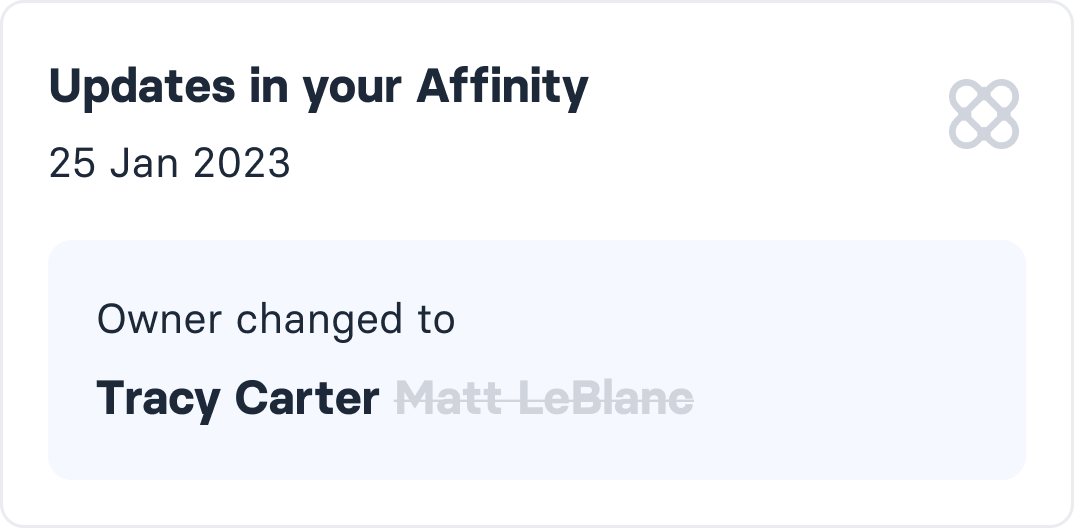
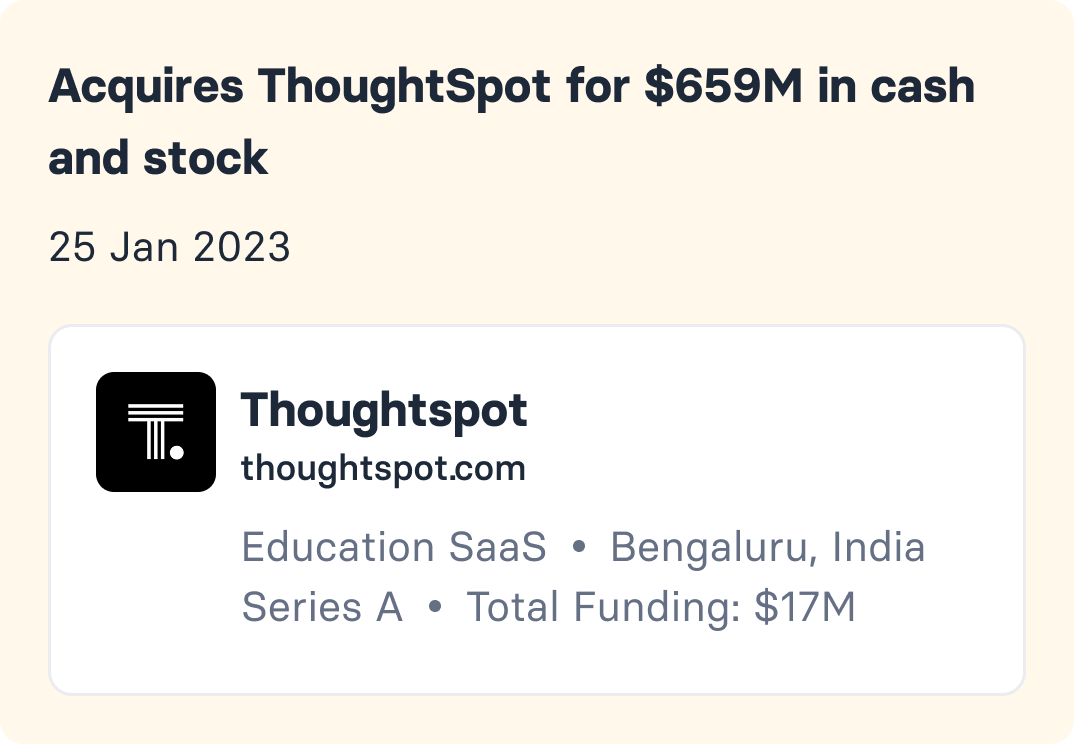
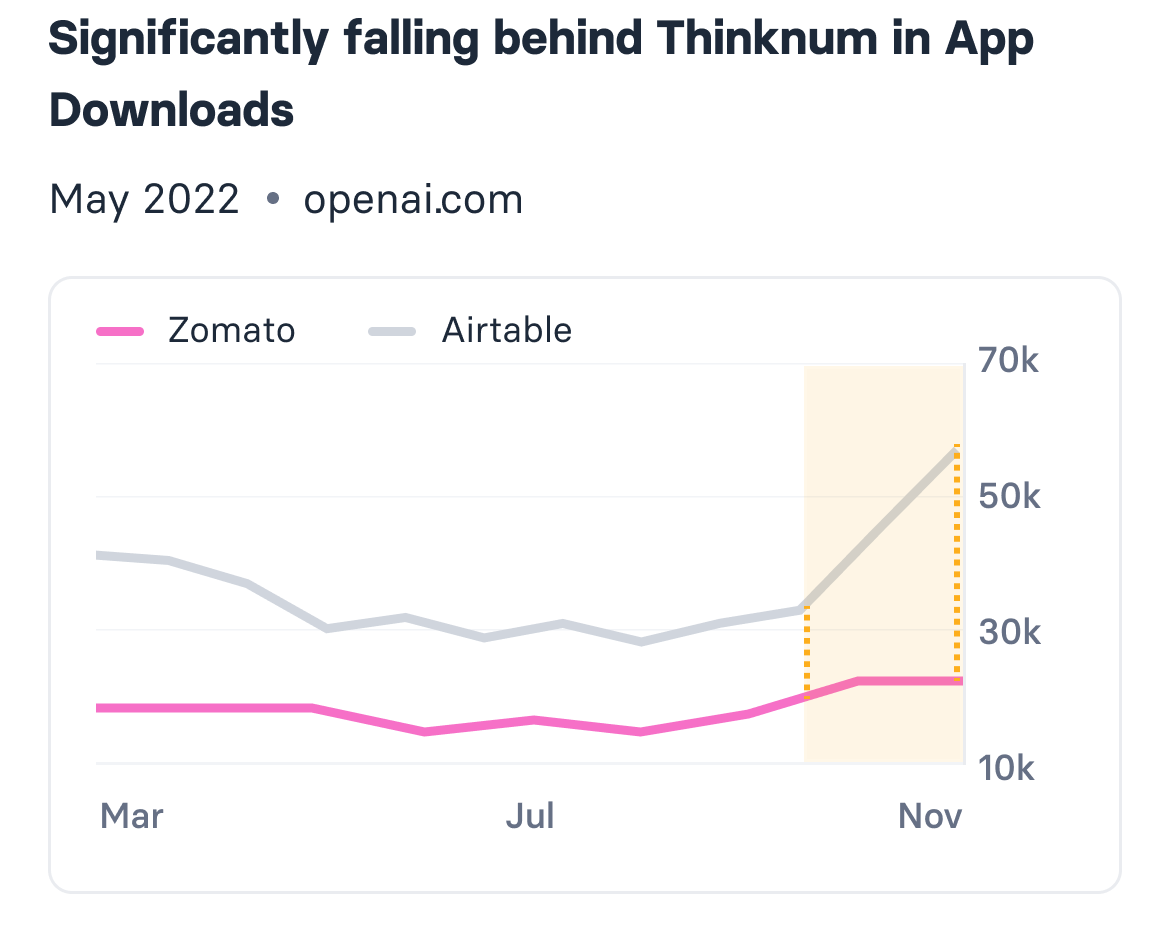
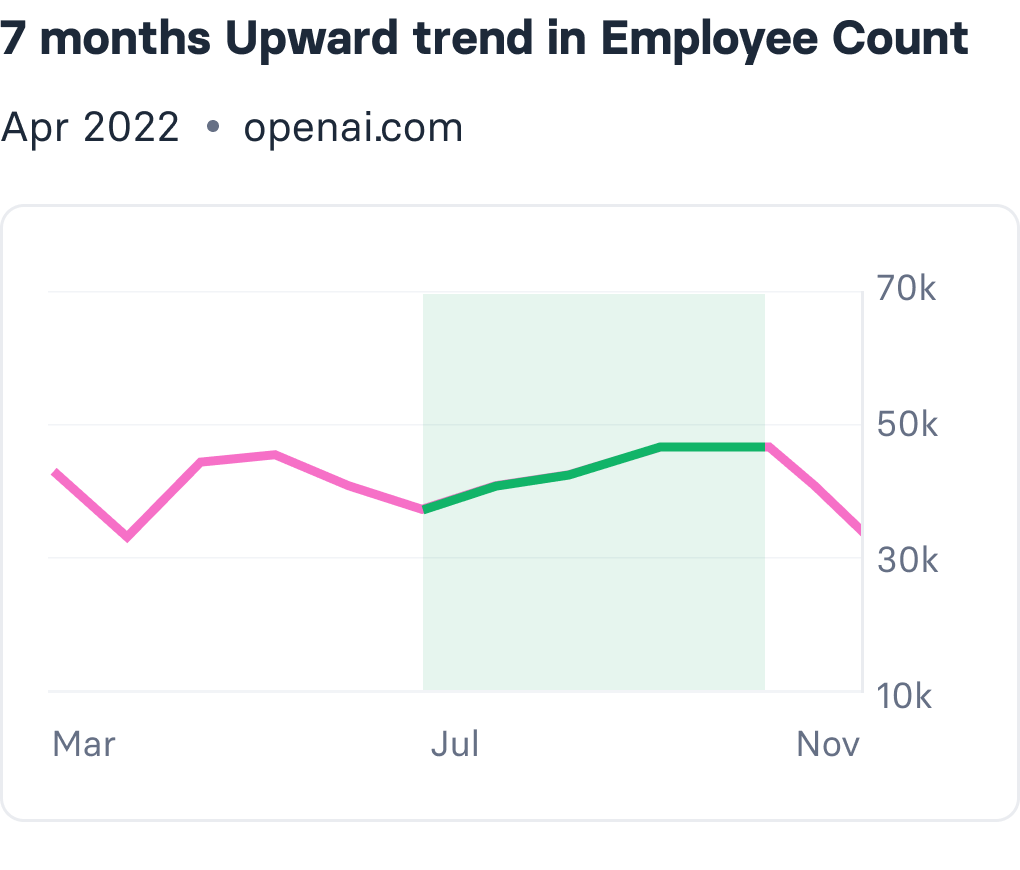
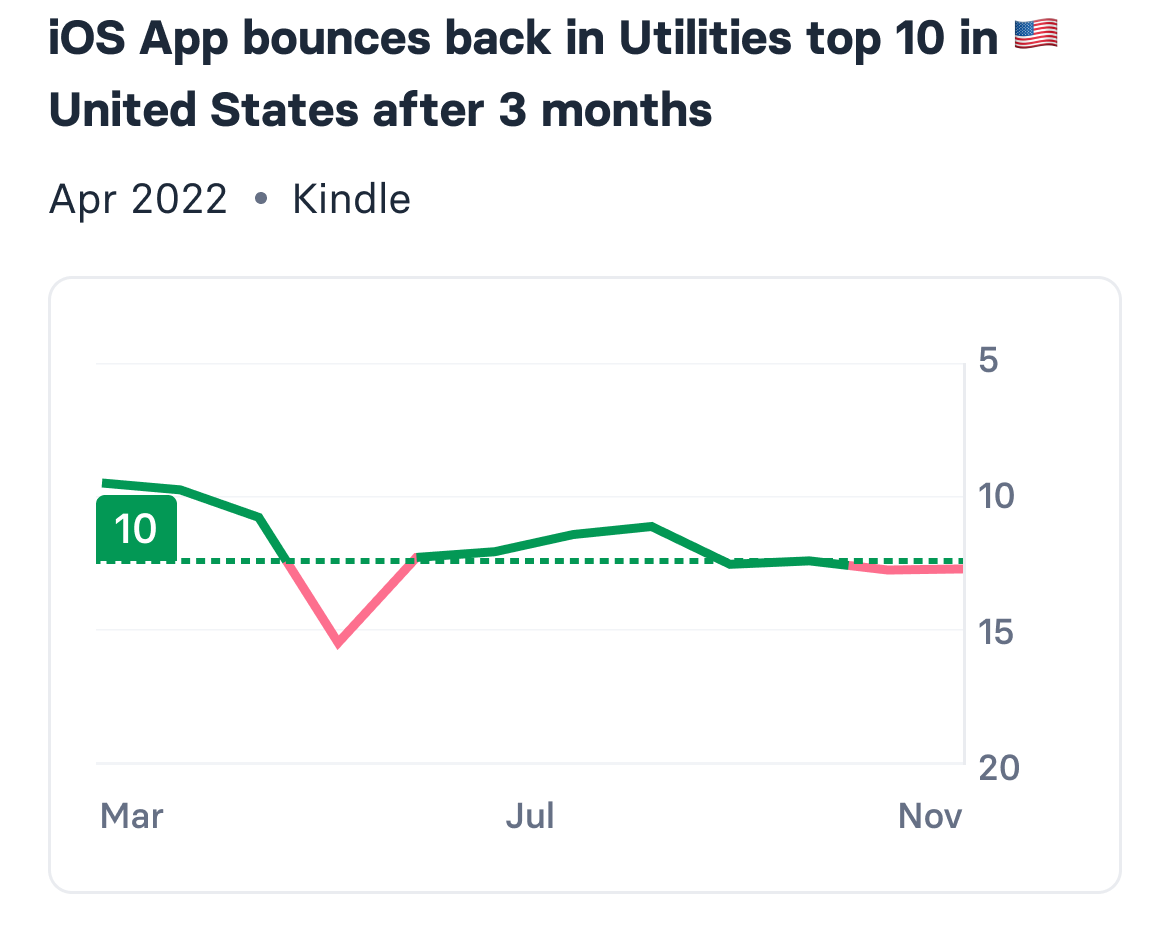
People card: a design manager promoted to Head of Design, with their photo and new title Trend card: longest upward trend in observed sales in the past two years, with the run shaded on the chart Ranking card: beats WhatsApp to take top position in the social apps list in India, with the top three ranked and their movement Compact milestone card: observed customers reach 200k in Australia, with an inline sparkline CRM card carrying new notes created in Affinity, shown as a swipeable stack Review sentiment card breaking mentions into salary benefits, job security and working conditions, each with a positive-negative bar Trend break card: end of a four month downward trend in organic traffic in the United States, with the break marked on the chart Funding signal card: $248M raised in a series C led by Dragoneer Investment Group Milestone card: observed customers reach 200k in Australia, with the threshold marked on the chart Collaboration card: a teammate added a company to your Affinity Crossover card: surpasses a competitor brand in observed sales, with the crossing point highlighted CRM card: updates in Affinity, showing deal owner changed from one person to another Acquisition card: acquires ThoughtSpot for $659M in cash and stock, with the target company's profile attached Comparison card: significantly falling behind a competitor in app downloads, with both series plotted Trend card: seven months of upward trend in employee count, with the run shaded Glassdoor card: twelve new reviews added, their distribution, and the rating falling from 3.9 to 2.9 Milestone card: iOS app bounces back into the utilities top ten in the United States after three months
Signal cards
Company page for Taxfix: header with follow action, growth index, industry, HQ, founded year, employee count and Glassdoor rating, founding team, funding rounds, CRM fields, timeline, news, then charts for growth index, total visits, observed sales, observed customers, employee count, active job count and organic traffic, Glassdoor reviews and similar companies
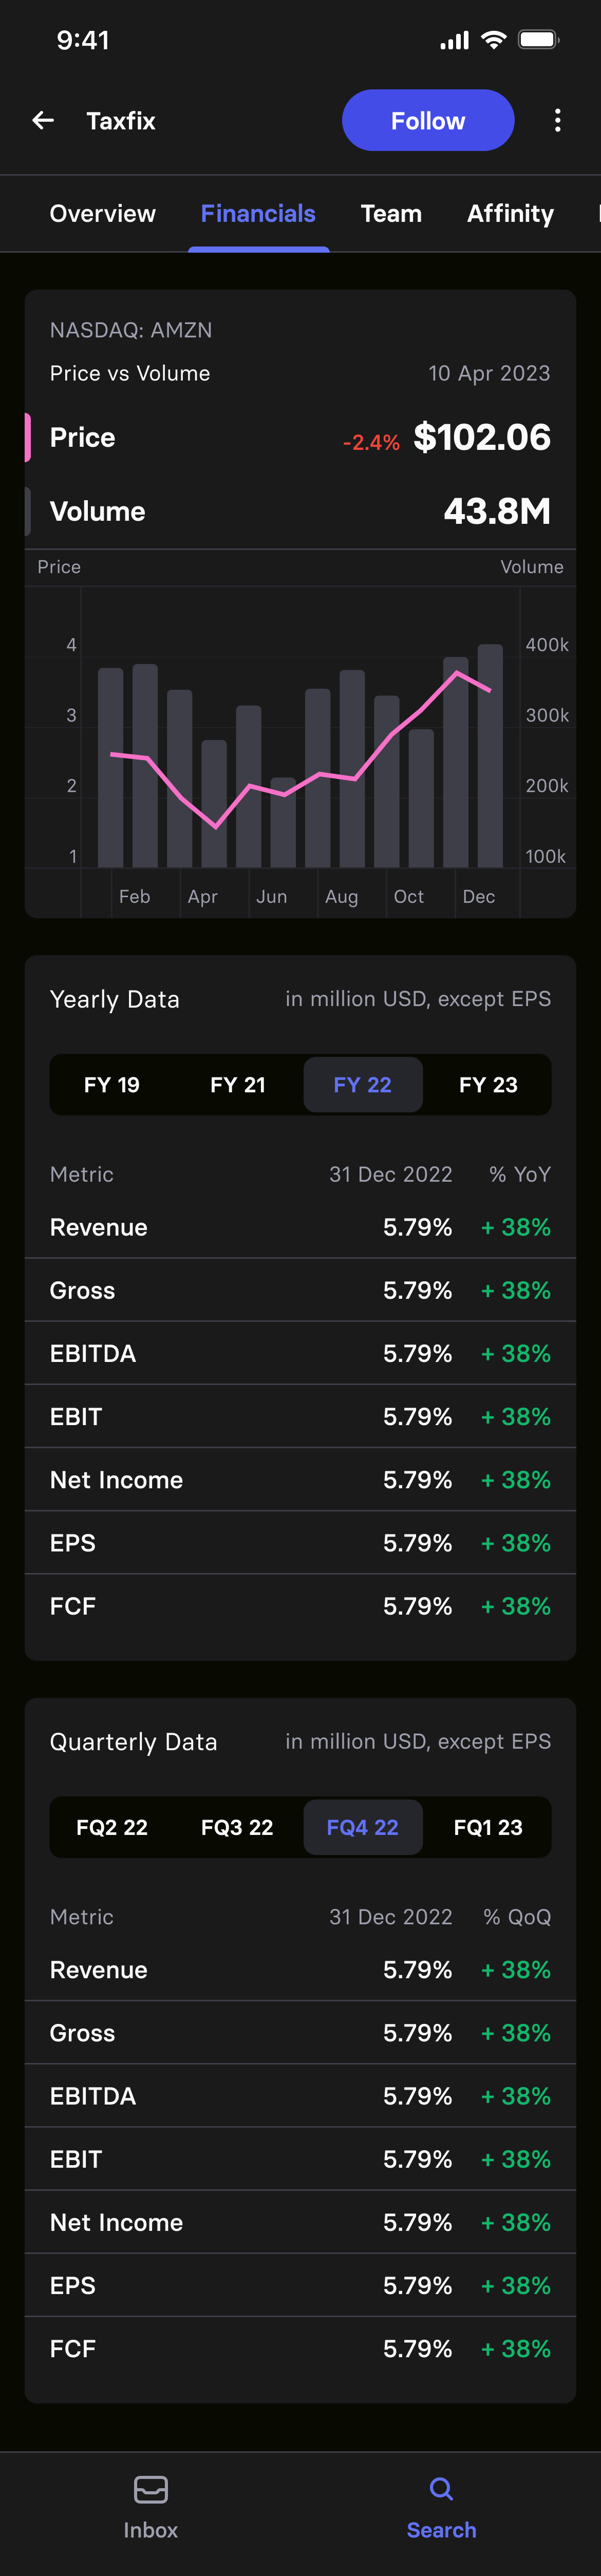
Financials tab of the company page: listed price versus volume with a combined bar and line chart, then yearly and quarterly tables of revenue, gross, EBITDA, EBIT, net income, EPS and free cash flow with year-on-year change
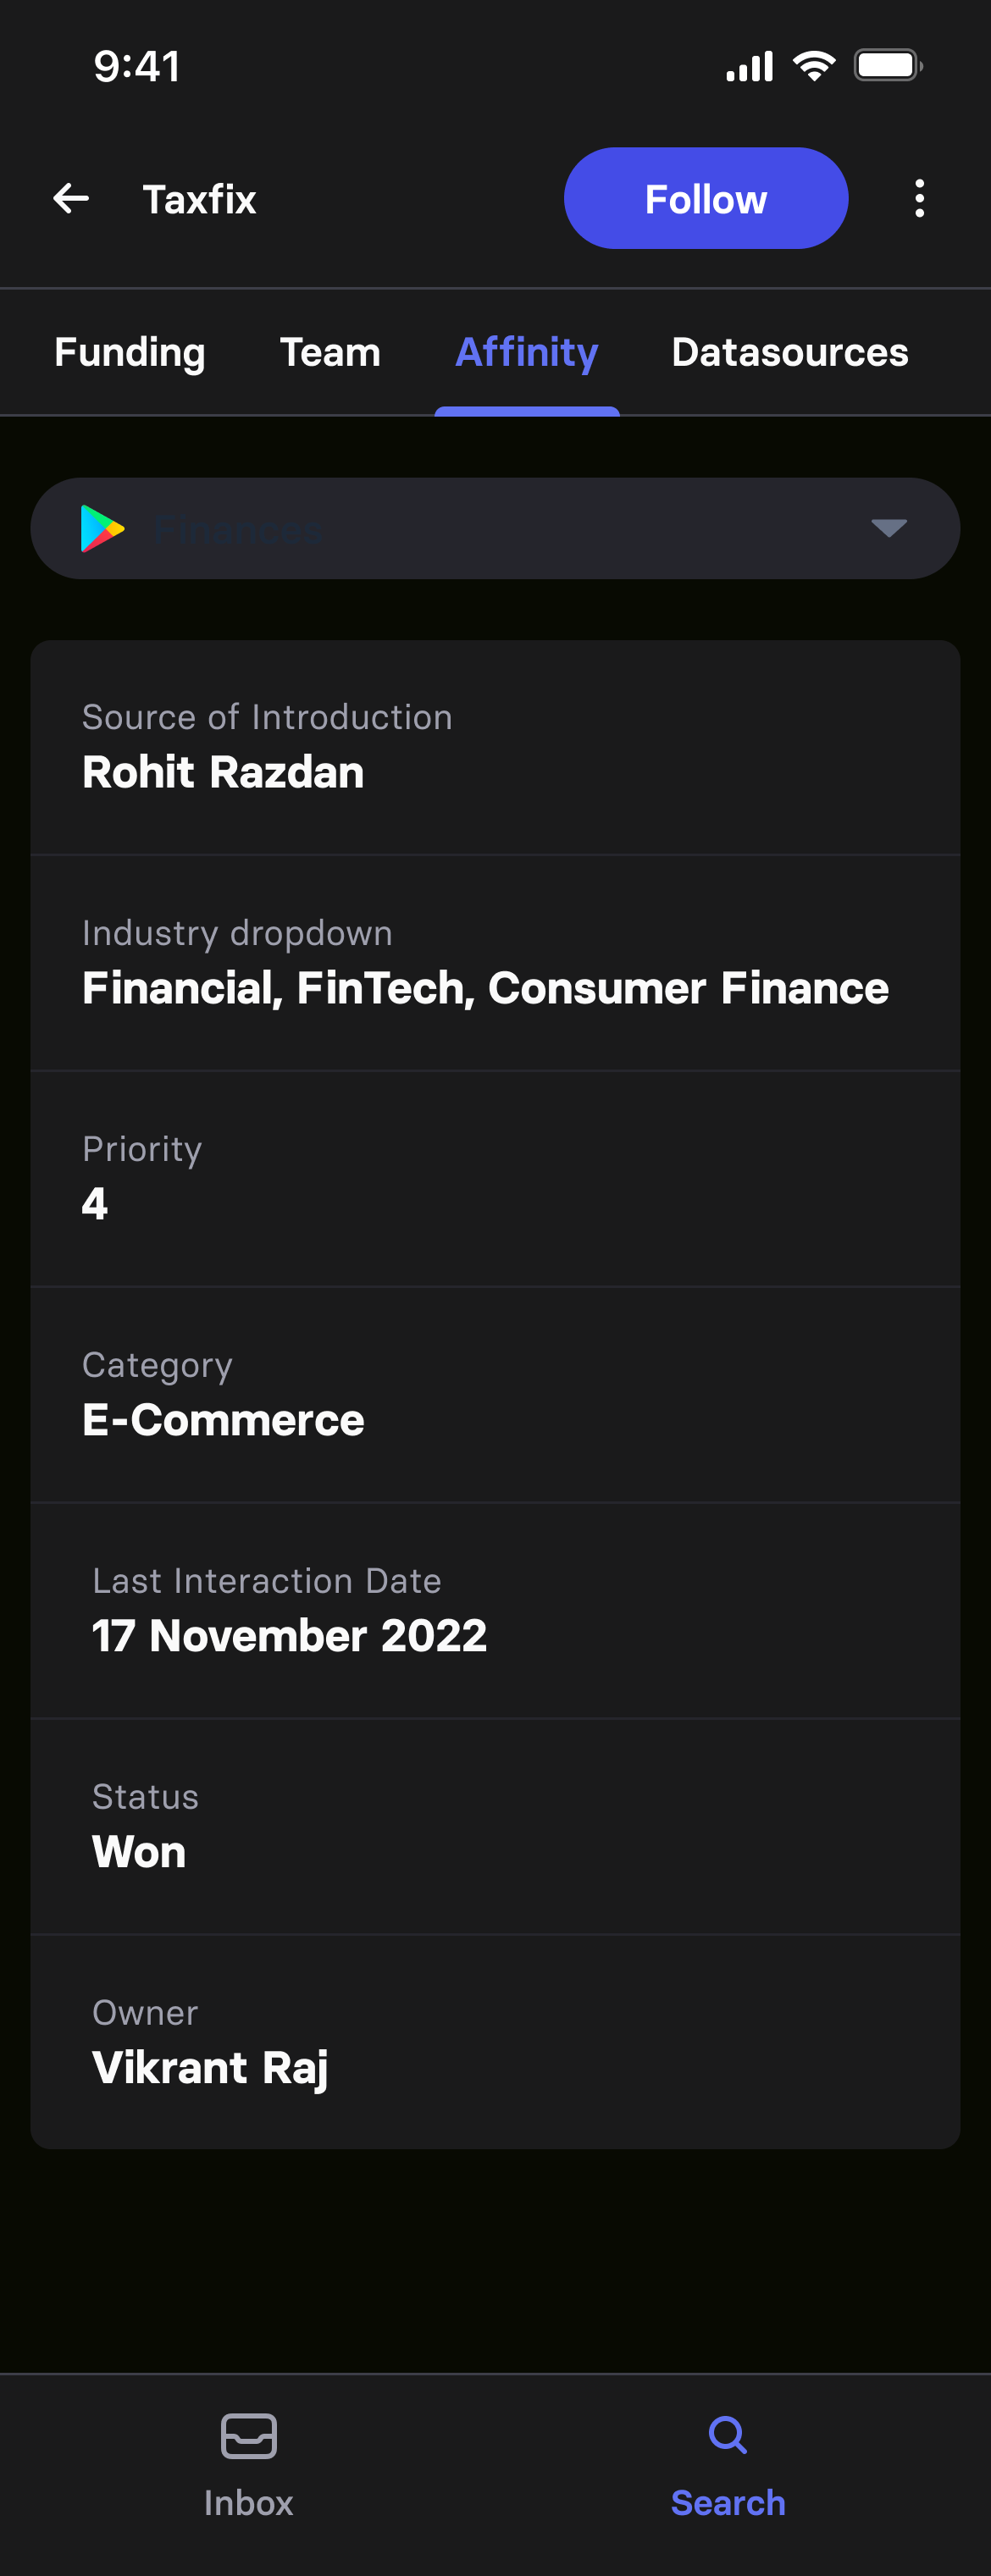
Affinity tab of the company page, pulling CRM fields through: source of introduction, industry, priority, category, last interaction date, deal status and owner
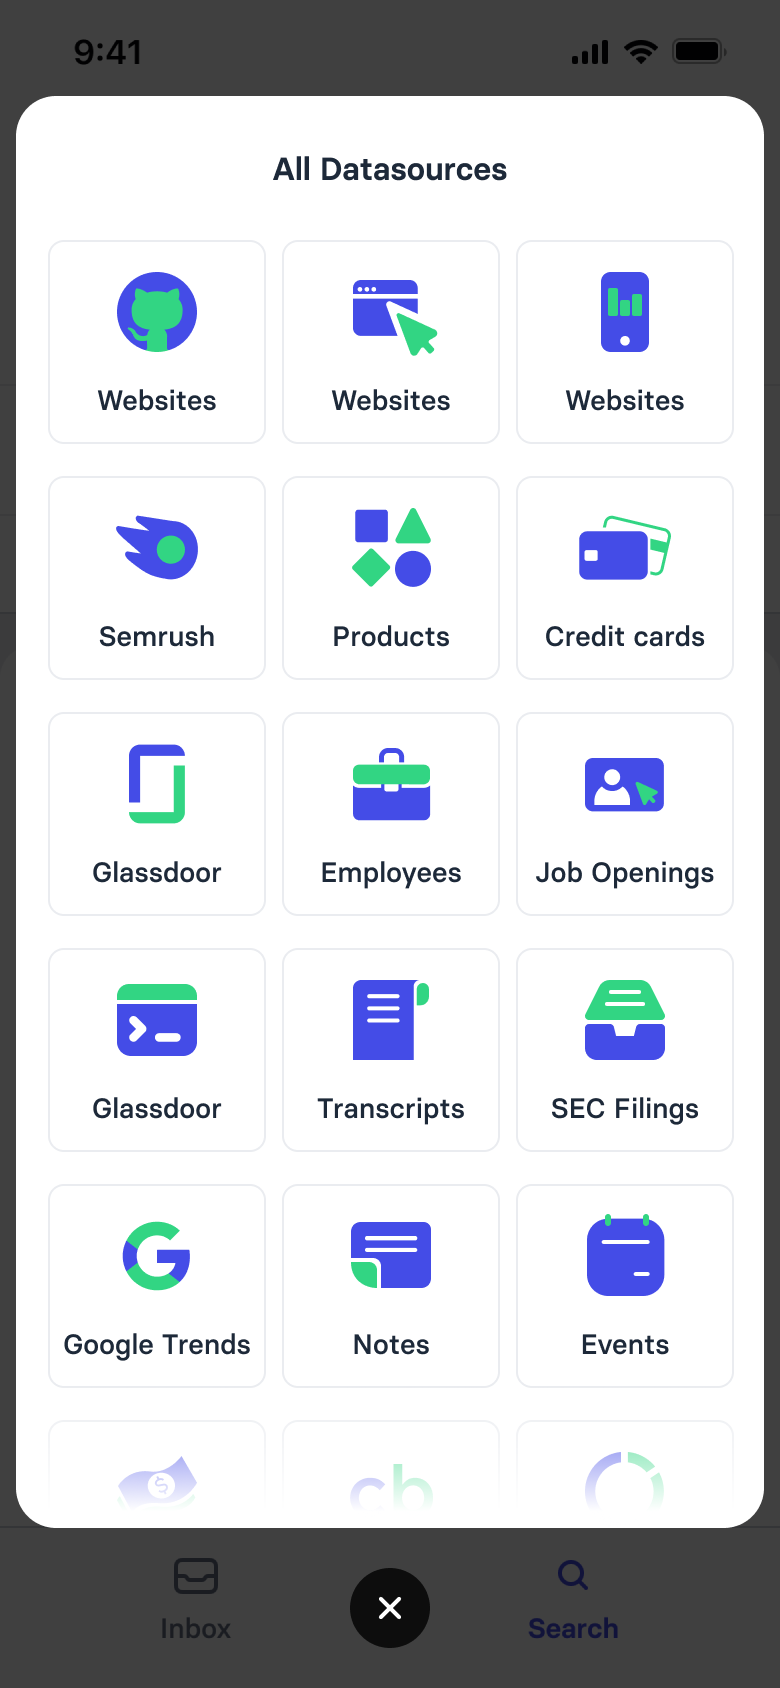
All Datasources sheet listing the datasets behind the app: websites, Semrush, products, credit cards, Glassdoor, employees, job openings, transcripts, SEC filings, Google Trends, notes and events
Company page tabs
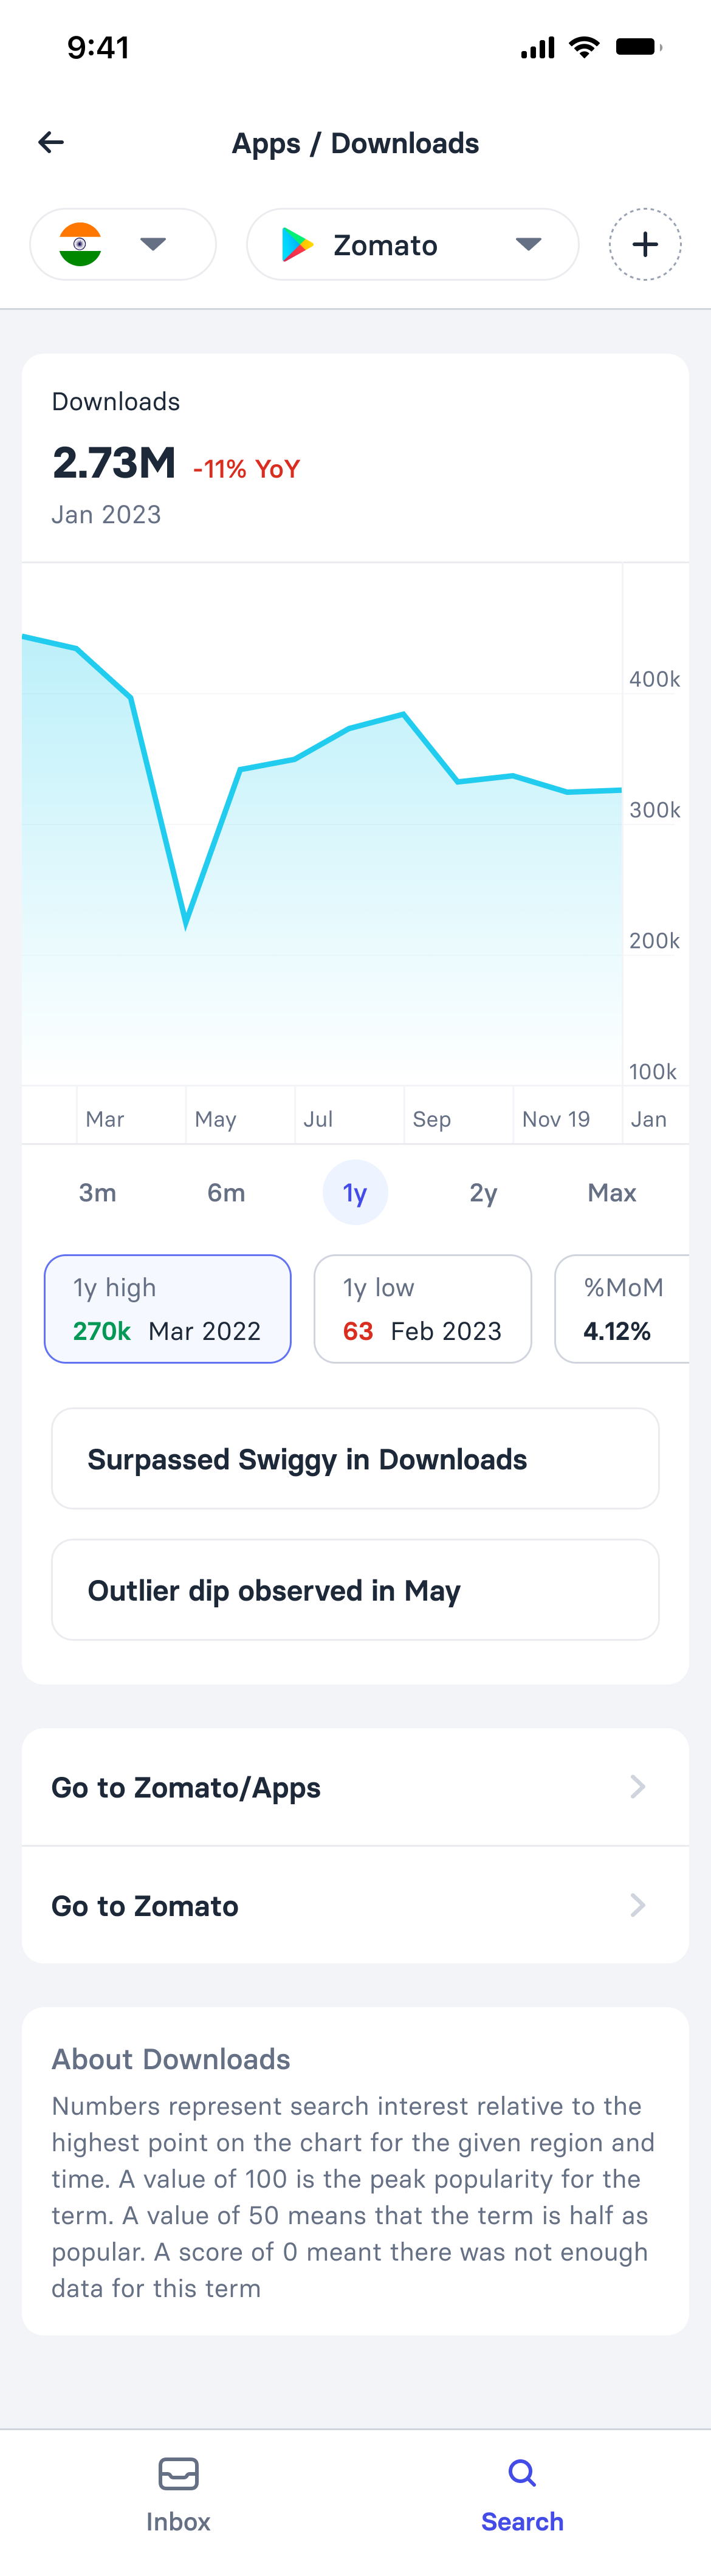
Metric detail for app downloads: headline figure with year-on-year change, a trend chart with range selector, one-year high, low and month-on-month stat chips, callouts for surpassing a competitor and an outlier dip, links through to the metric and company, and an explanation of the metric

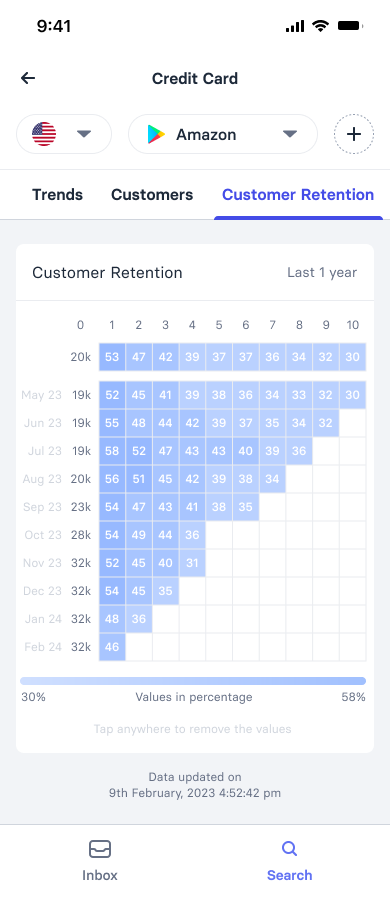
Credit card dataset on the customer retention tab: a cohort grid by month with retention percentages shaded by value, a scale from 30 to 58 percent, and the date the data was last updated
Metric detail
Semrush dataset for a company: a stack of Adwords traffic charts with the headline figure and year-on-year change, each series in its own colour
Glassdoor dataset on the reviews tab: filter, word count and section controls, a review search, and individual reviews with rating, role, recommendation flags, pros and cons
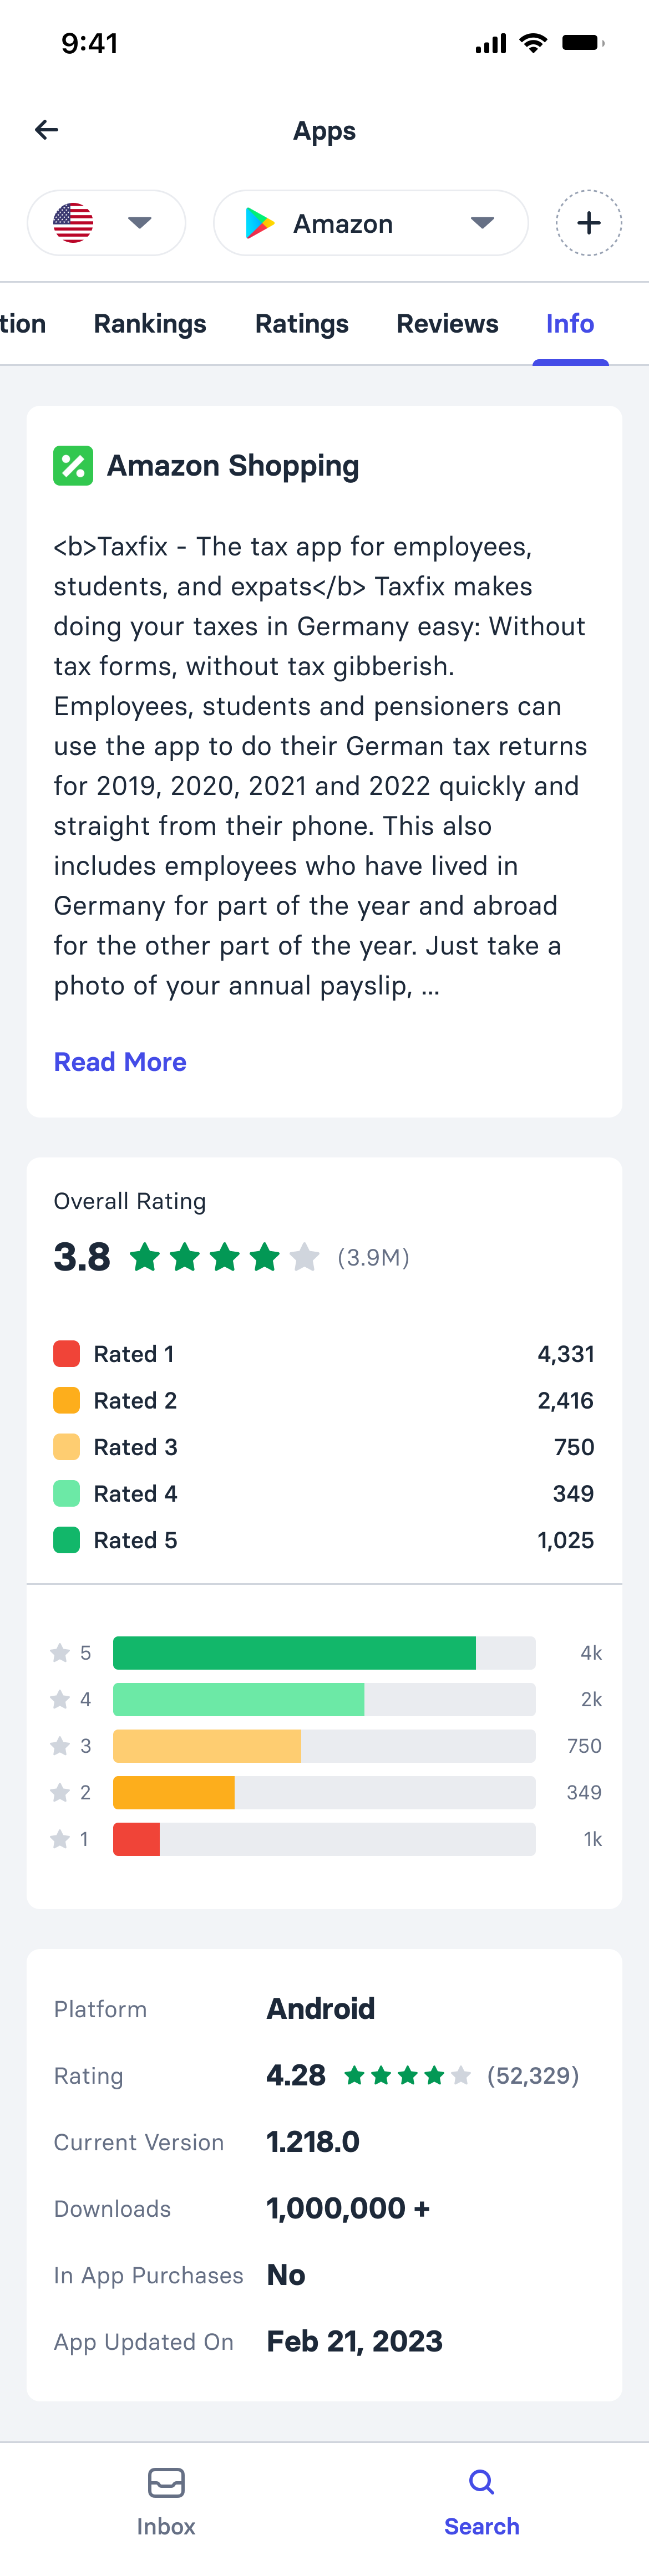
App store dataset on the info tab: store listing description, overall rating with its distribution across one to five stars, and platform, version, downloads and last-updated details
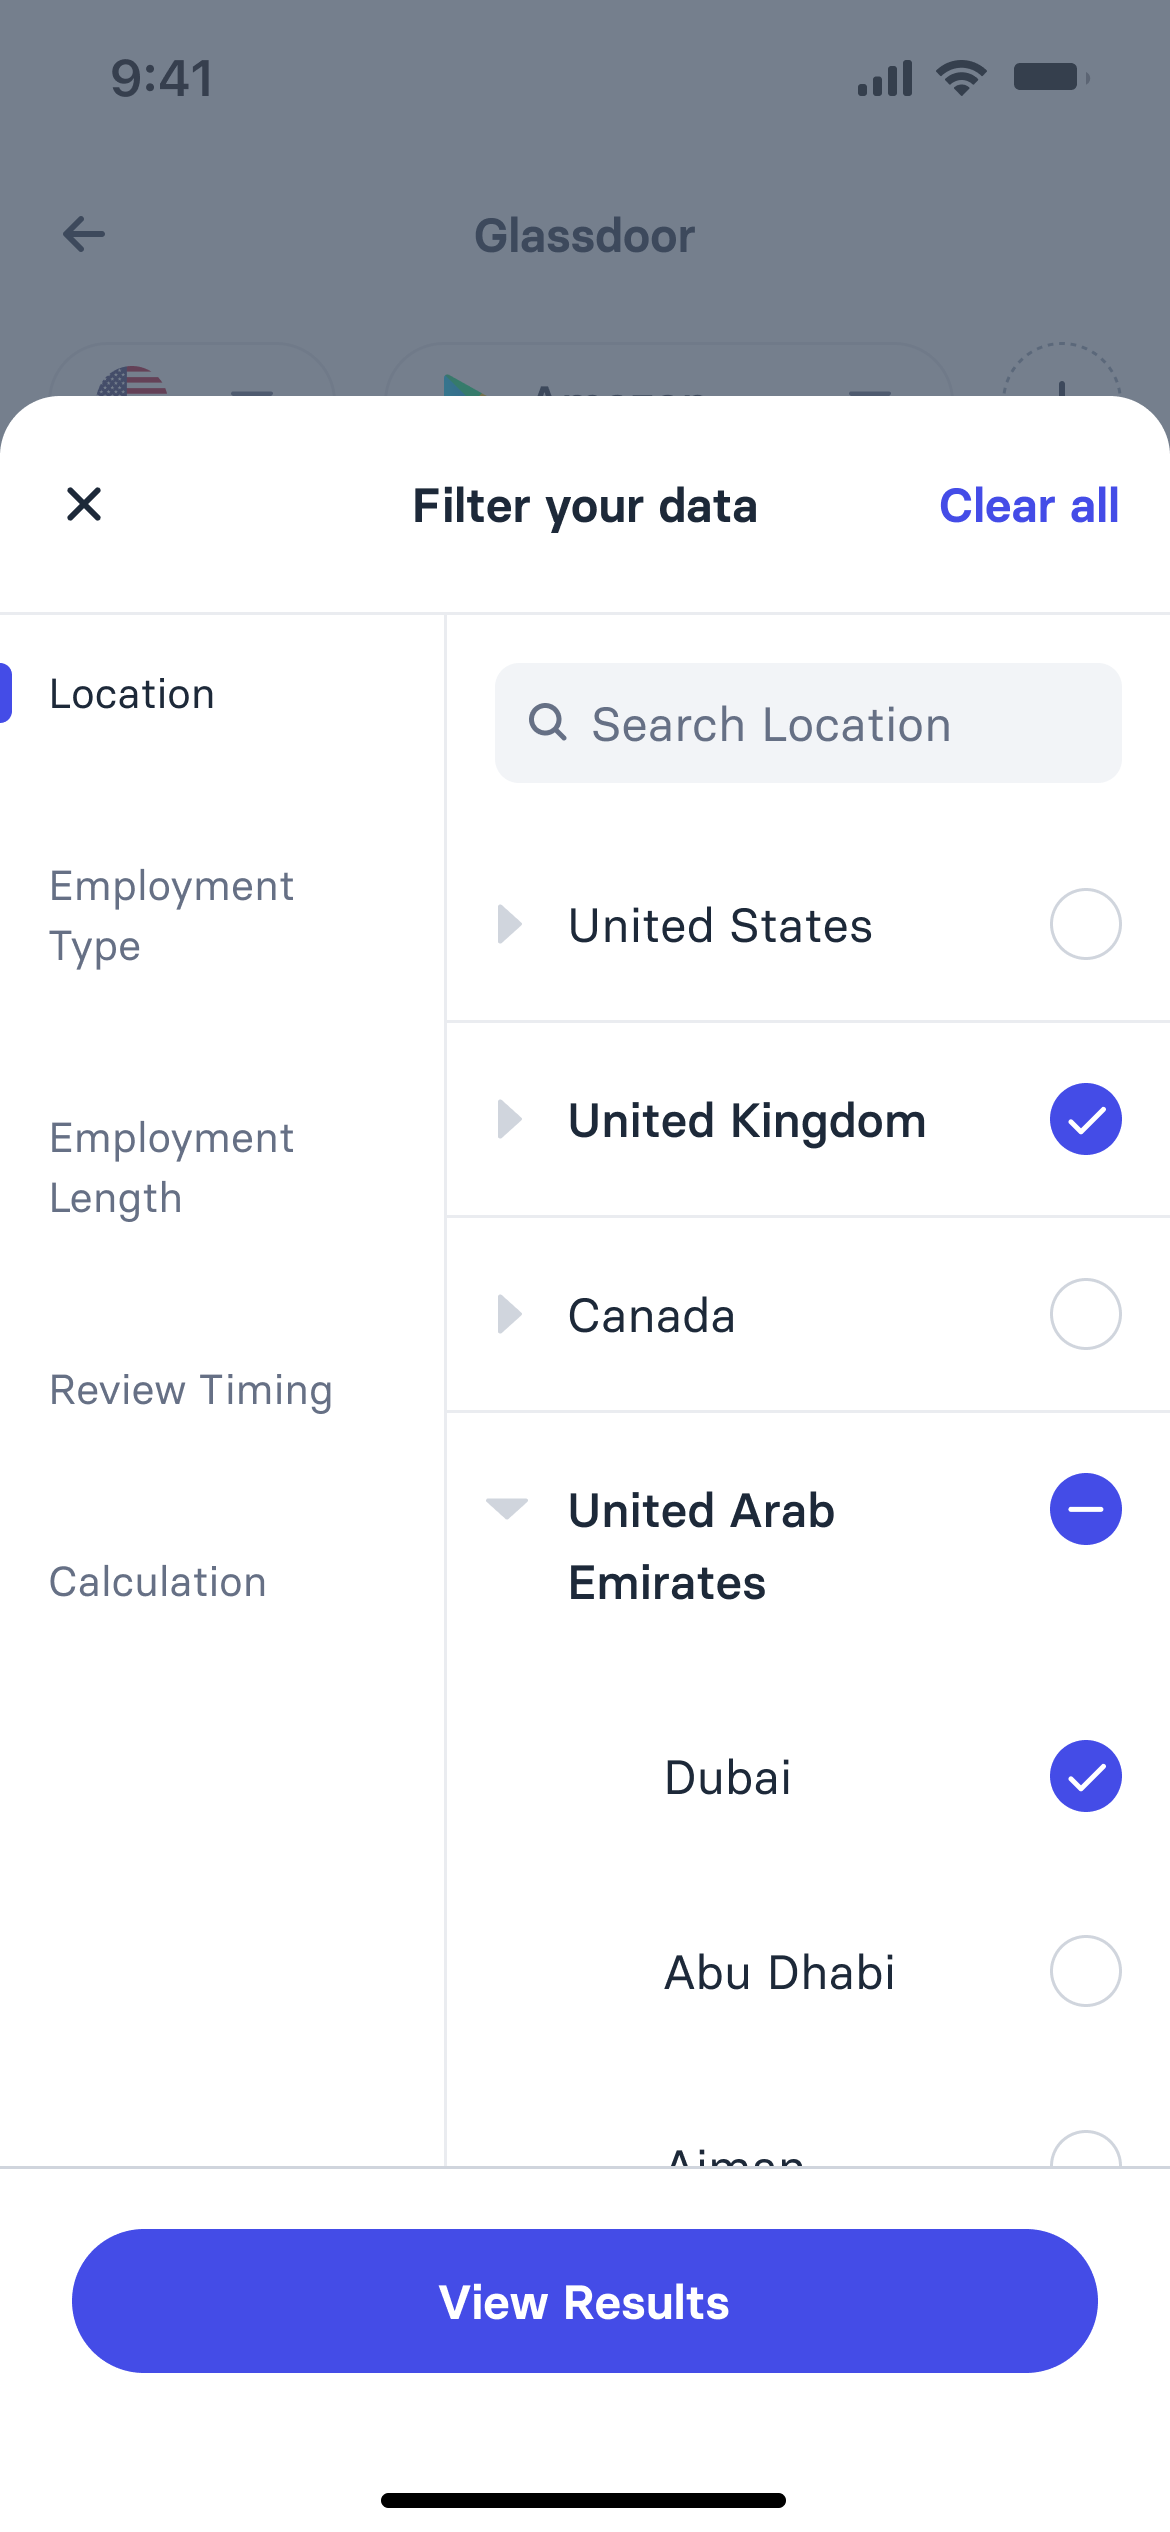
Filter your data sheet over the Glassdoor dataset: location, employment type, employment length, review timing and calculation categories, with a country and city tree part-selected, and a view results action
Datasets
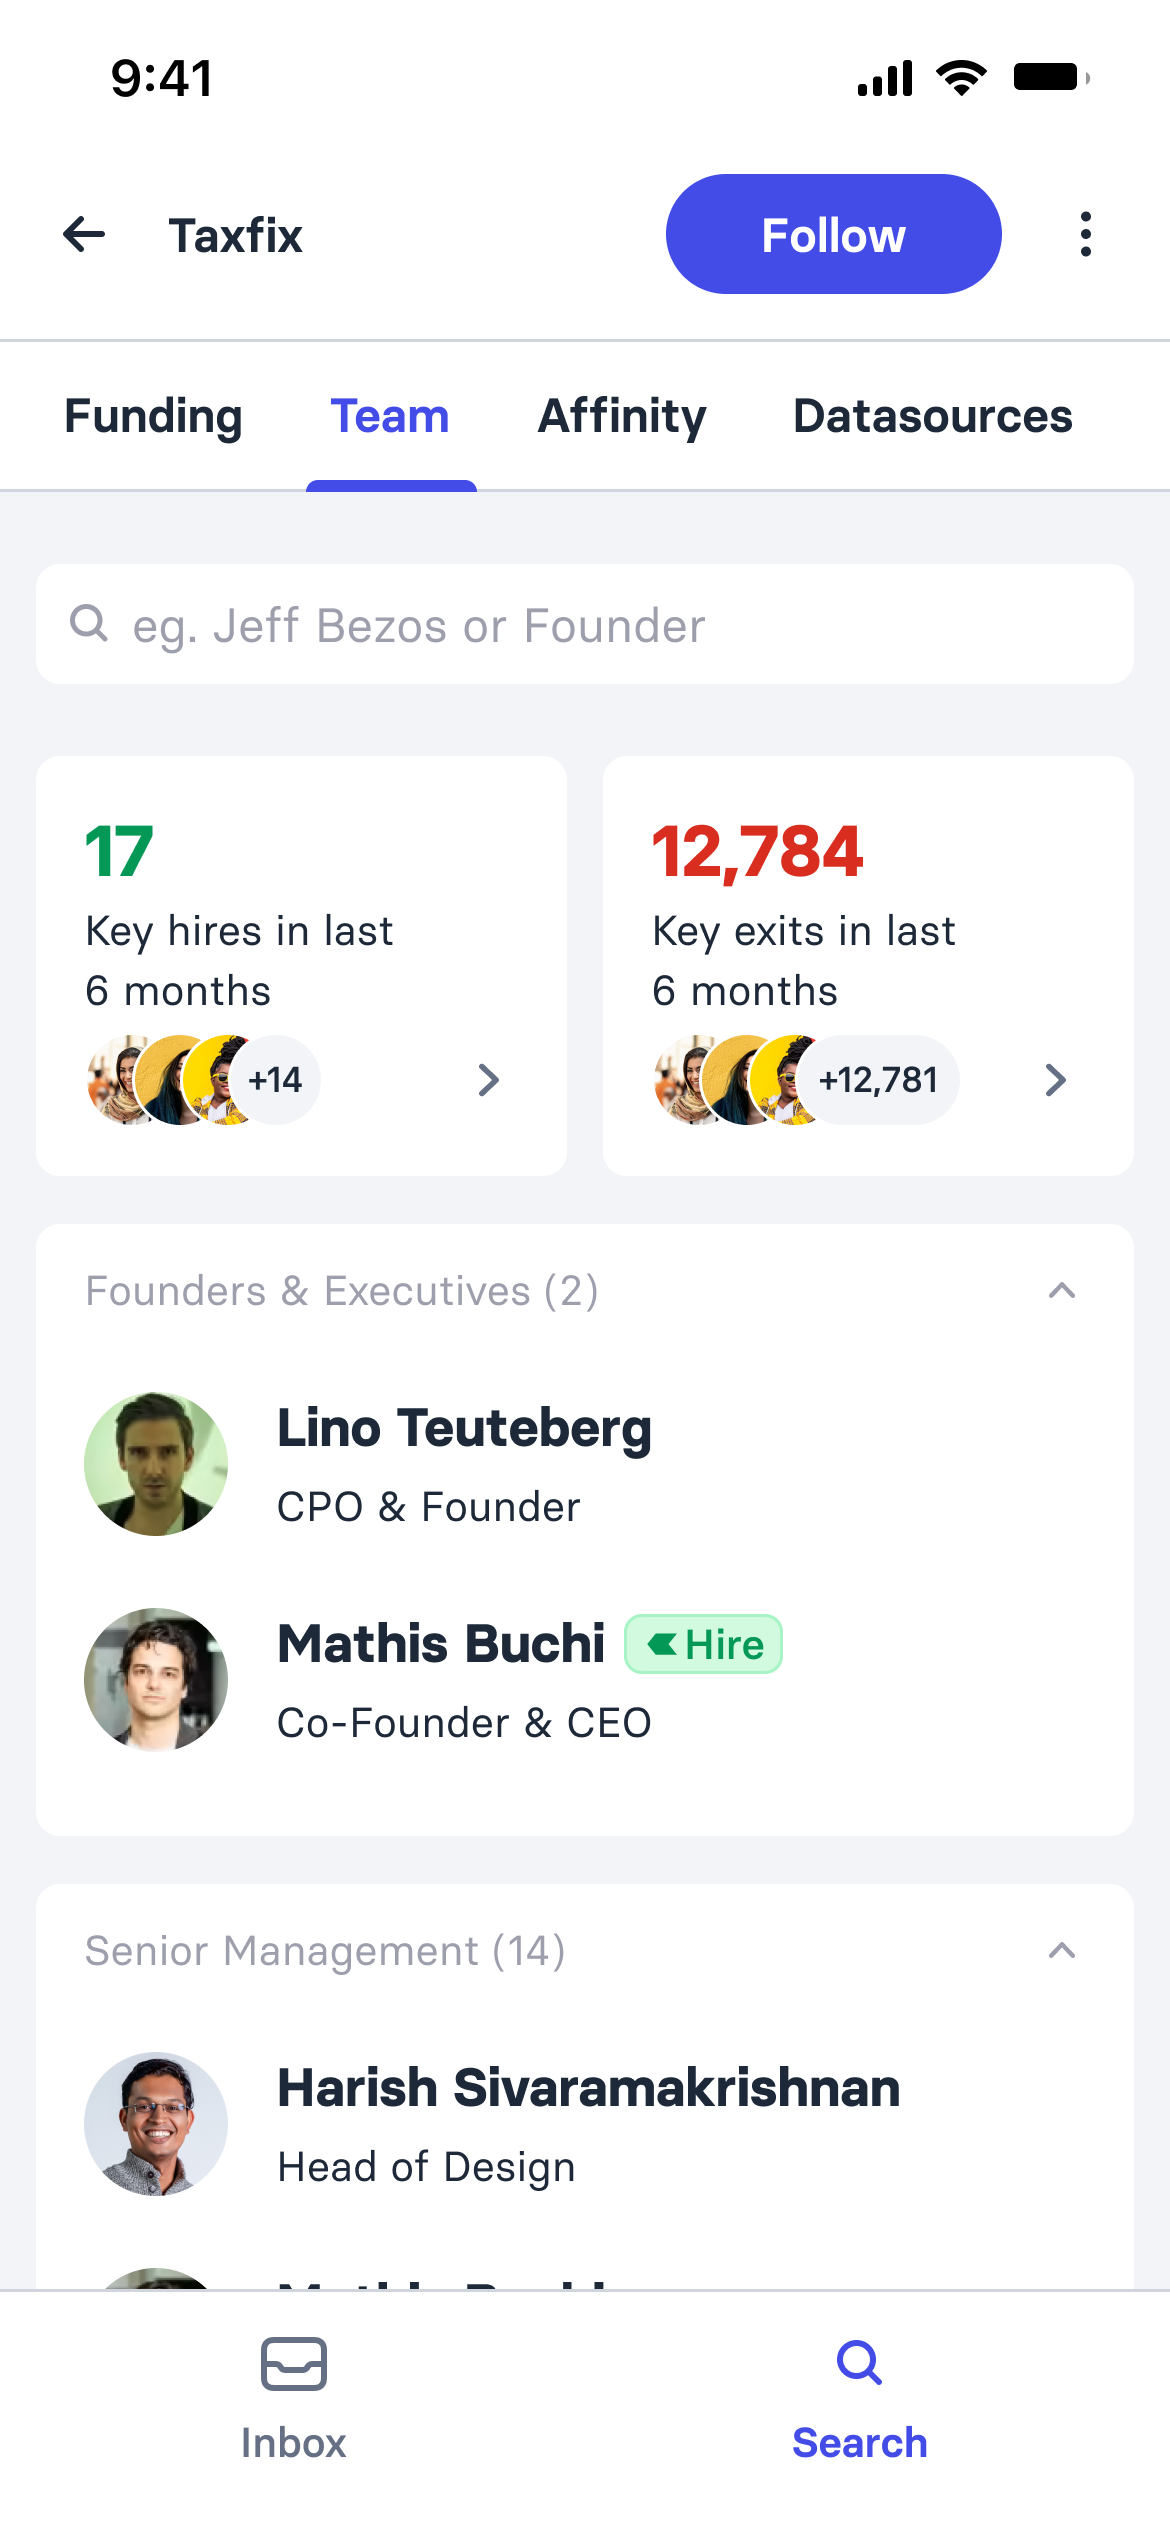
Team tab of a company page: a person search, key hires and key exits in the last six months with counts and avatars, then founders and executives and senior management with photos, names, titles and hire flags
Person profile for a senior product manager: photo, current role and tenure, contact and LinkedIn actions, nine work experiences with dates and descriptions, and five education entries
People data
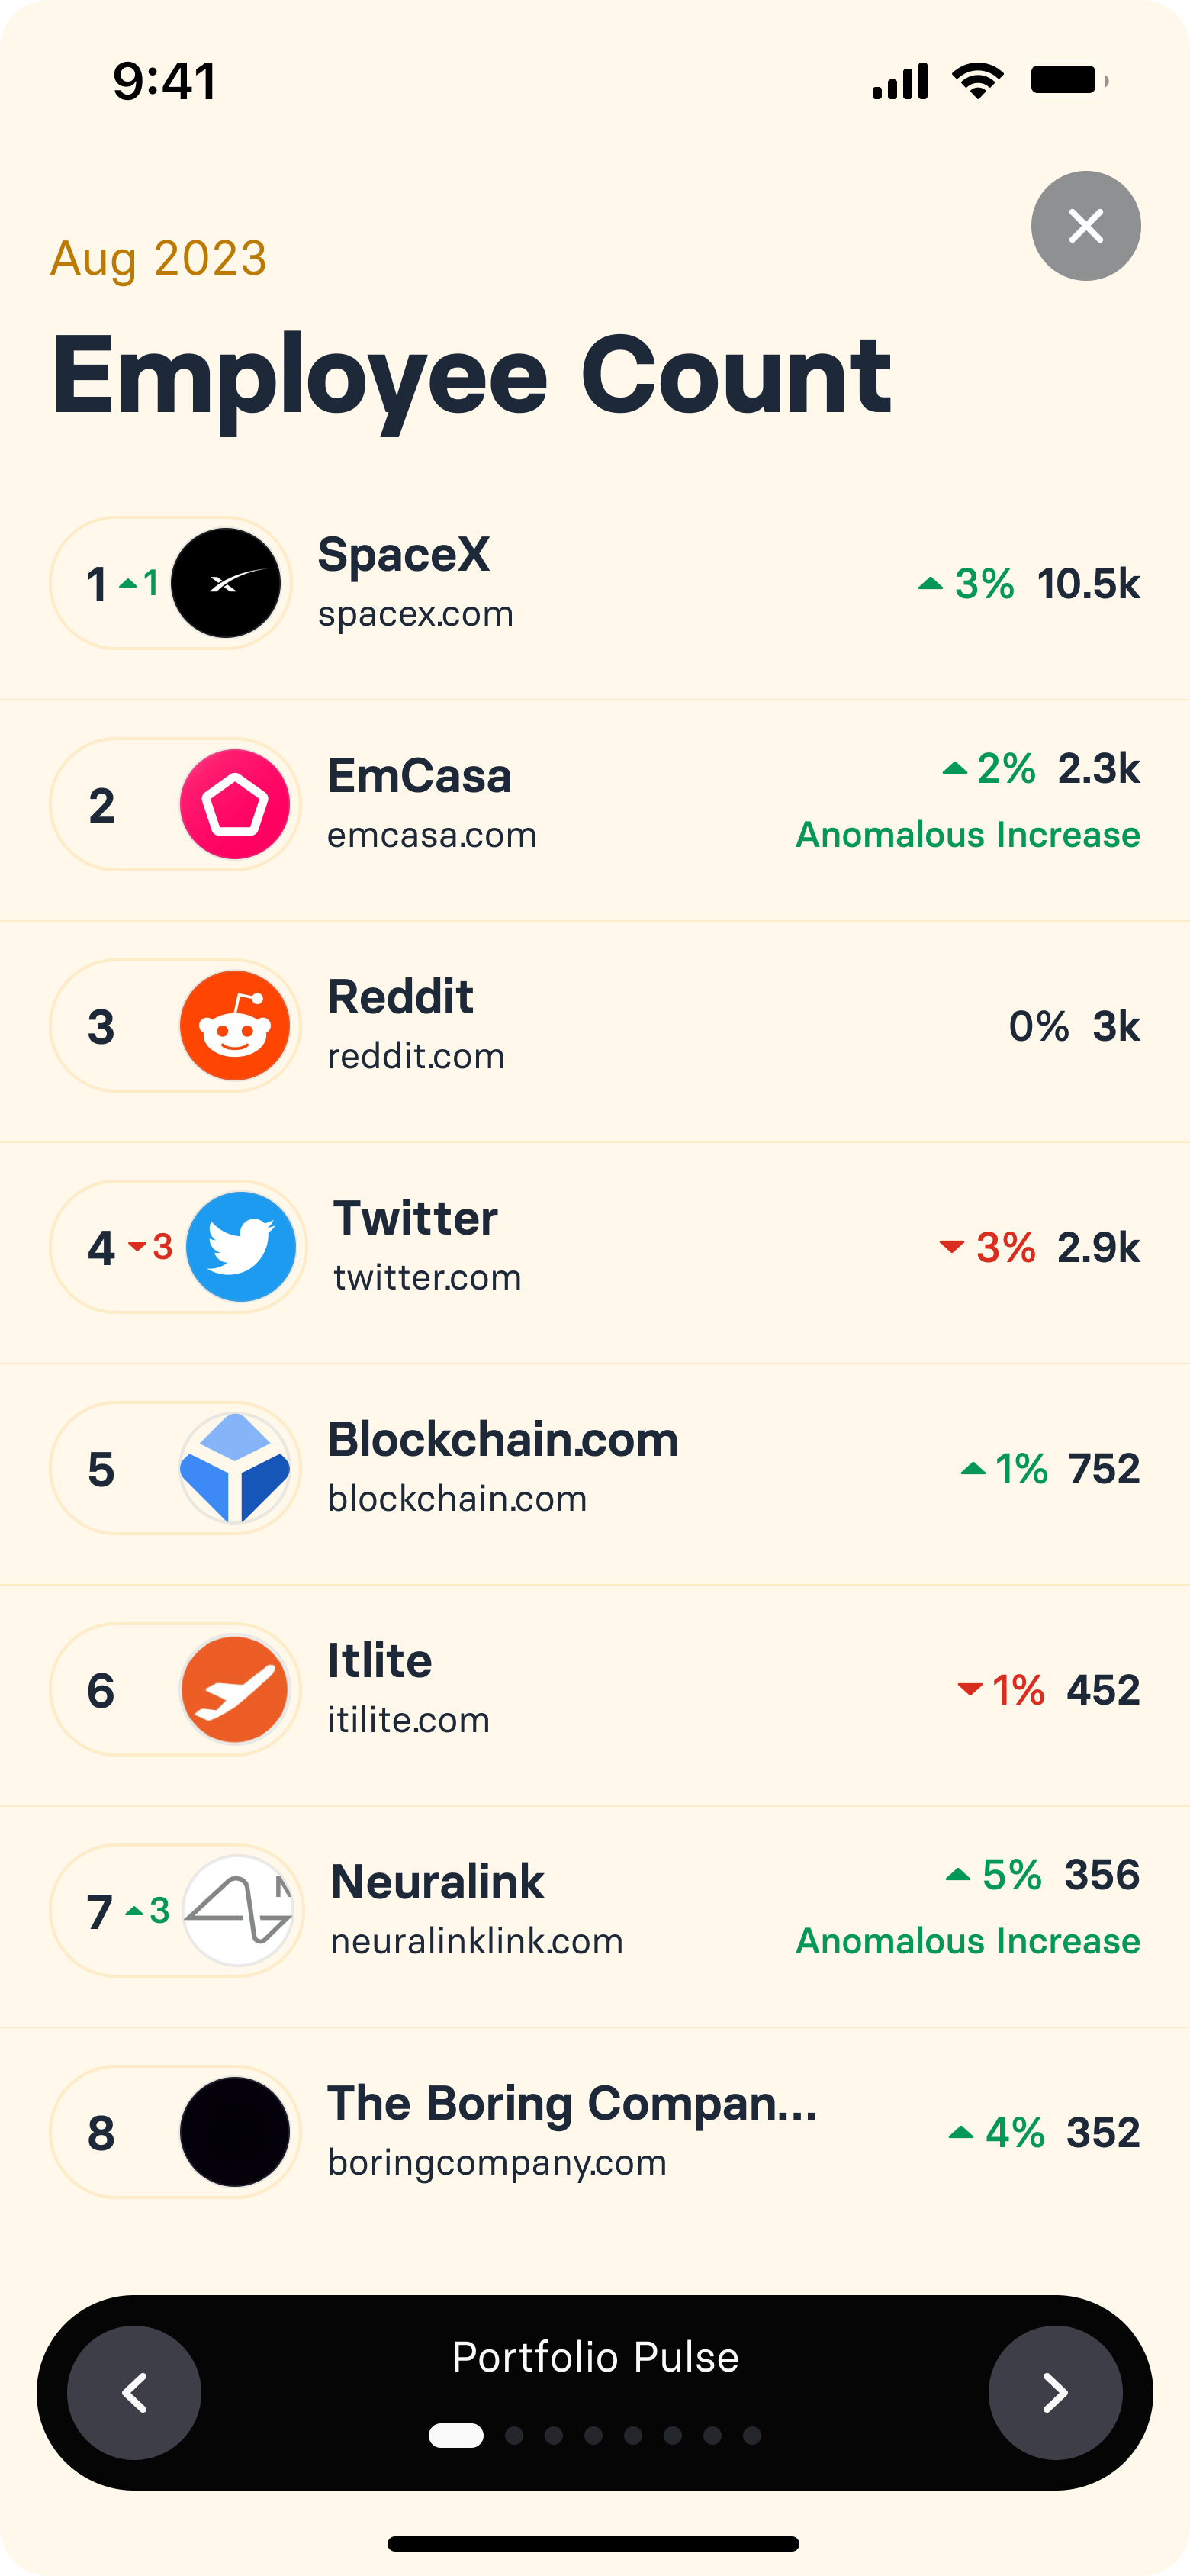
Portfolio pulse card tracking employee count over time
Portfolio pulse card tracking news article volume
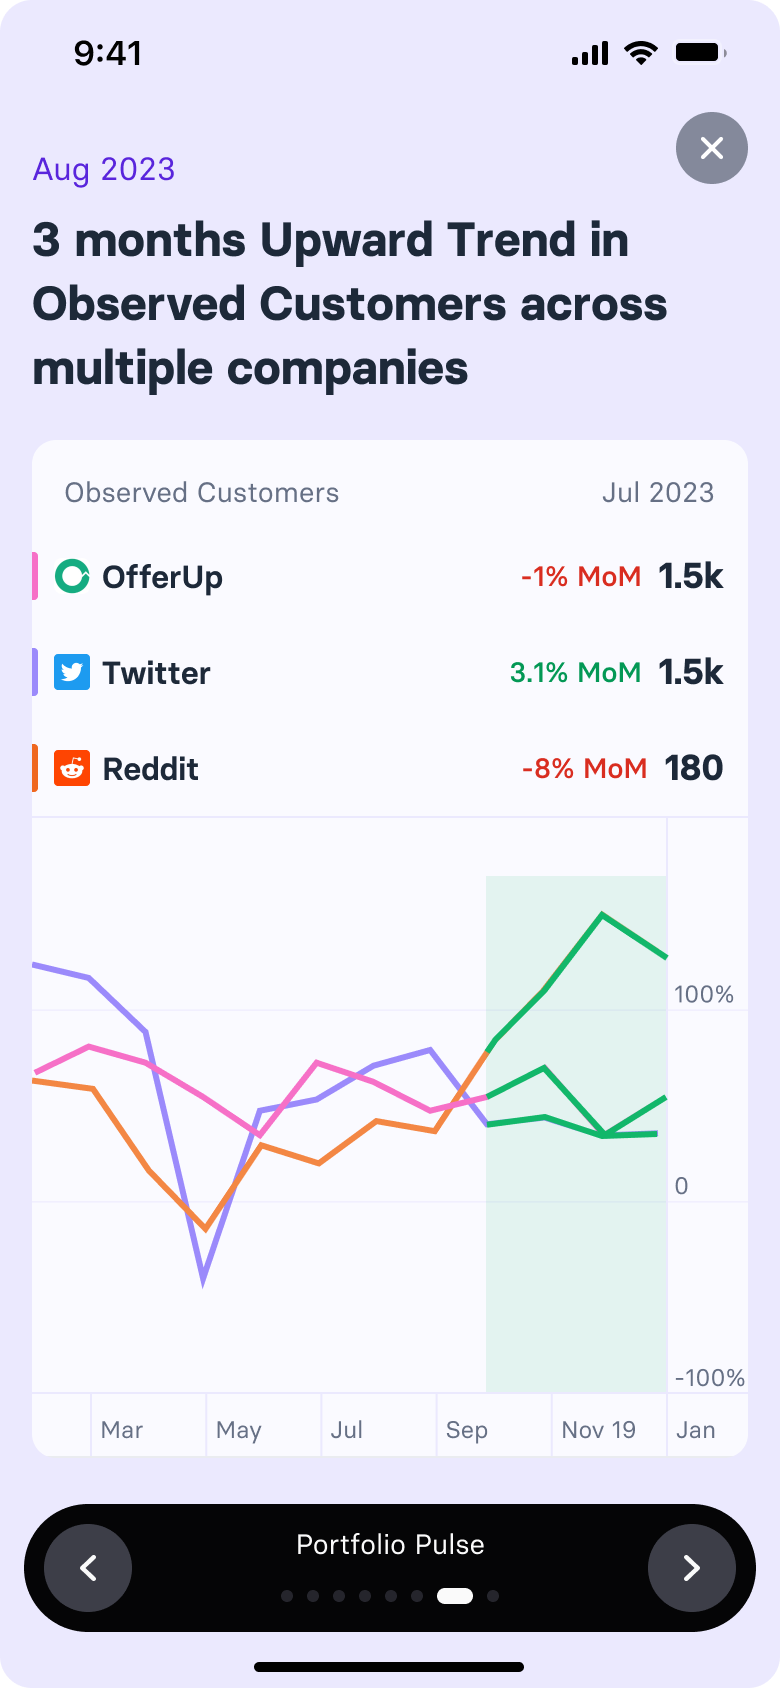
Portfolio pulse trend view
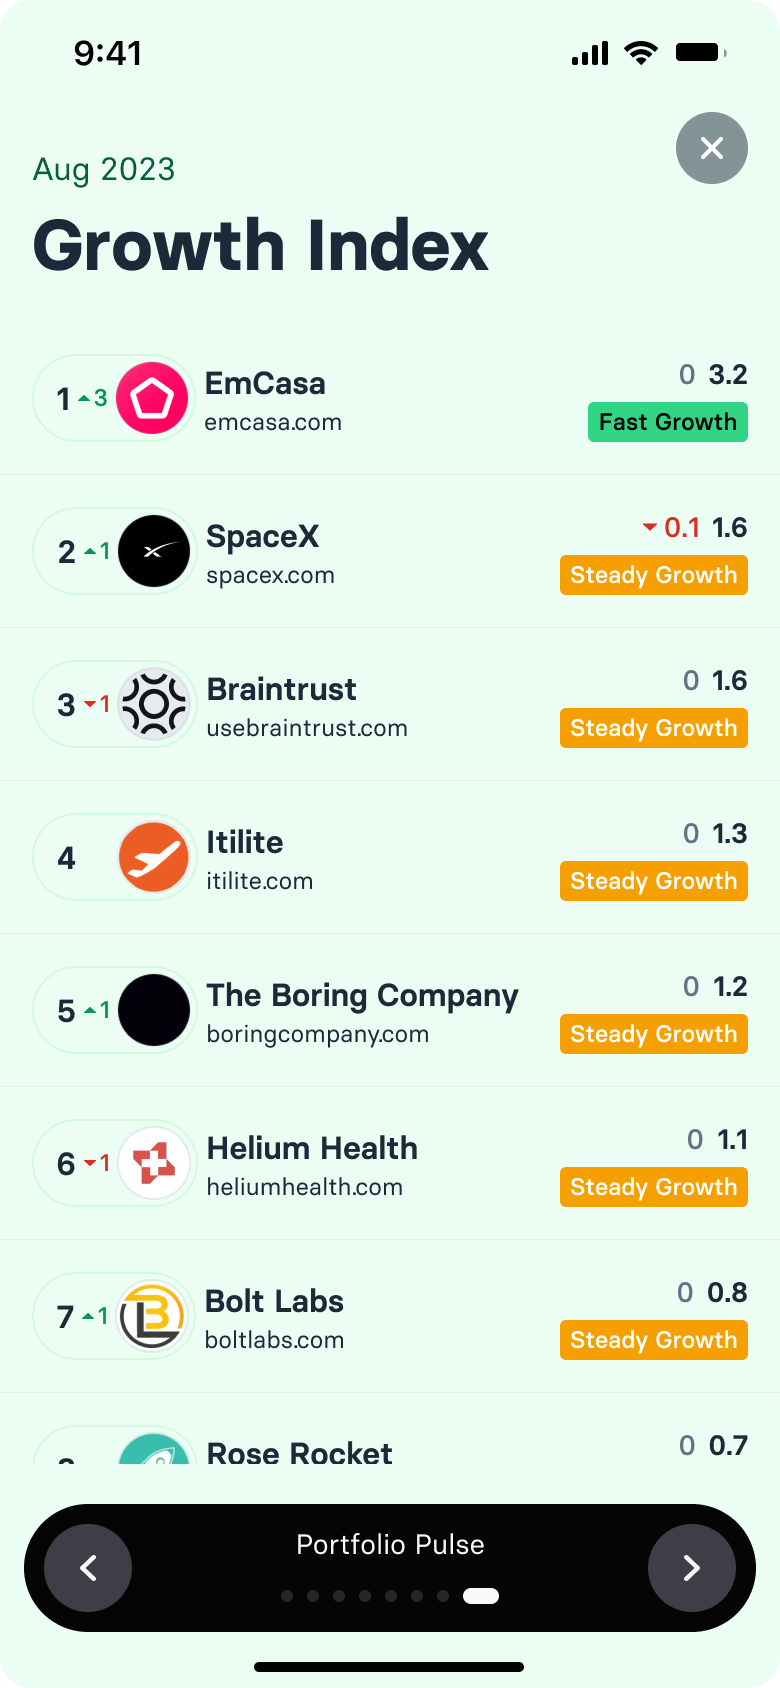
Portfolio pulse growth index
Portfolio pulse
Cheat sheet summarising what changed for a company since the last meeting
Year in Review story: minutes spent in the app, most viewed companies, insights generated, an activity report card, most viewed metric, most viewed sector and a feedback prompt
Cheat sheet · Year in review
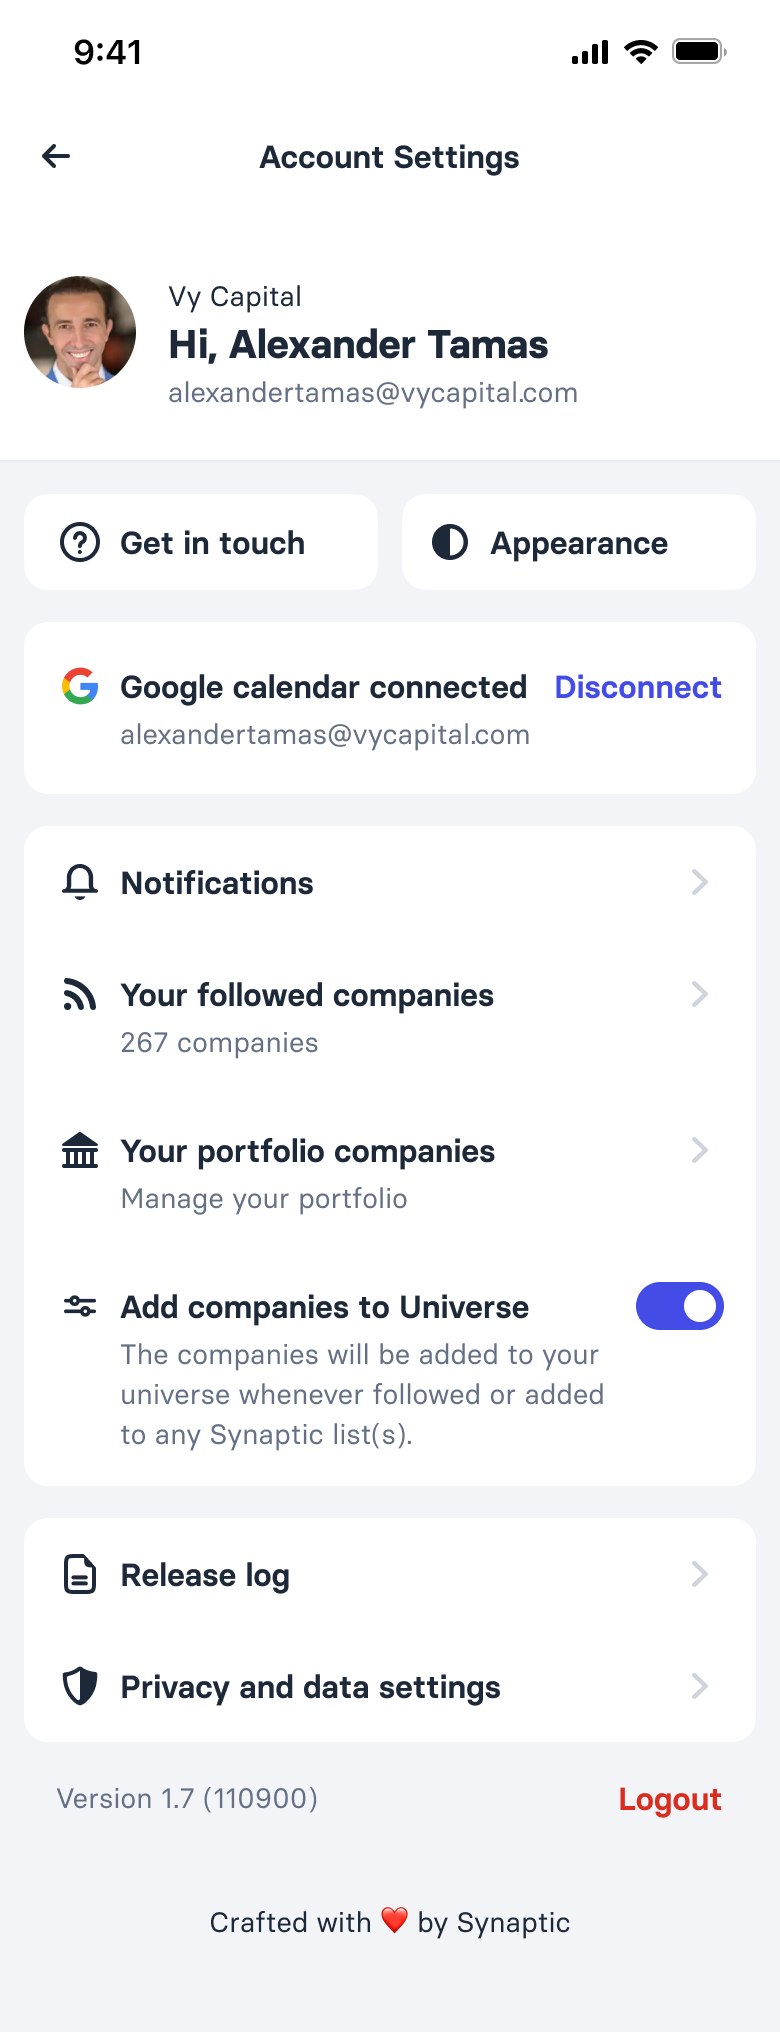
Account settings in light mode: profile card, get in touch and appearance shortcuts, connected Google calendar, notifications, followed and portfolio companies, add companies to universe toggle, release log, privacy settings and logout
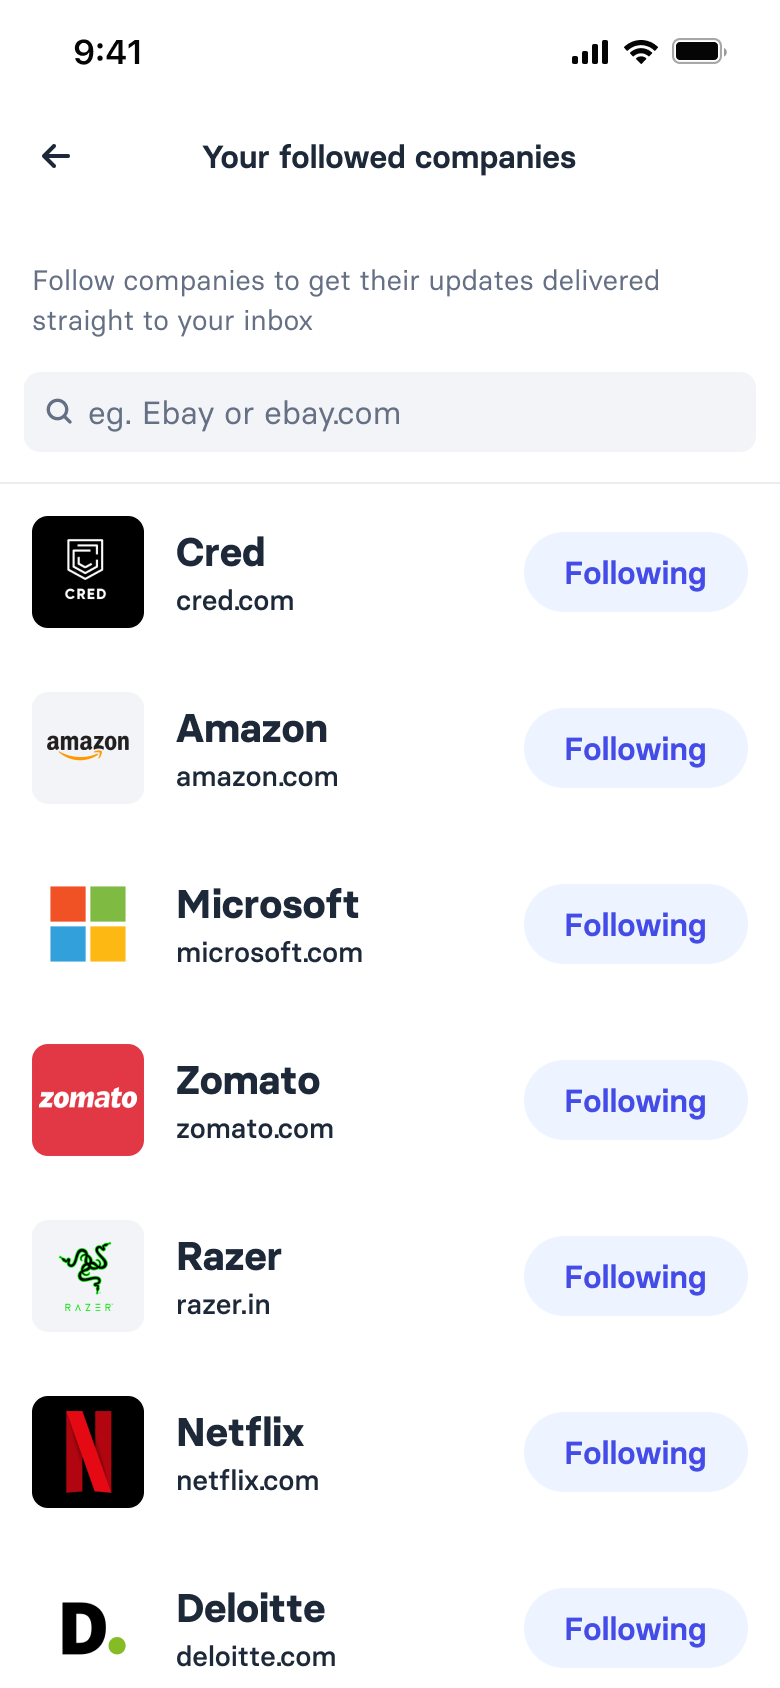
Your followed companies with a search field and a list of followed companies, each with a Following toggle
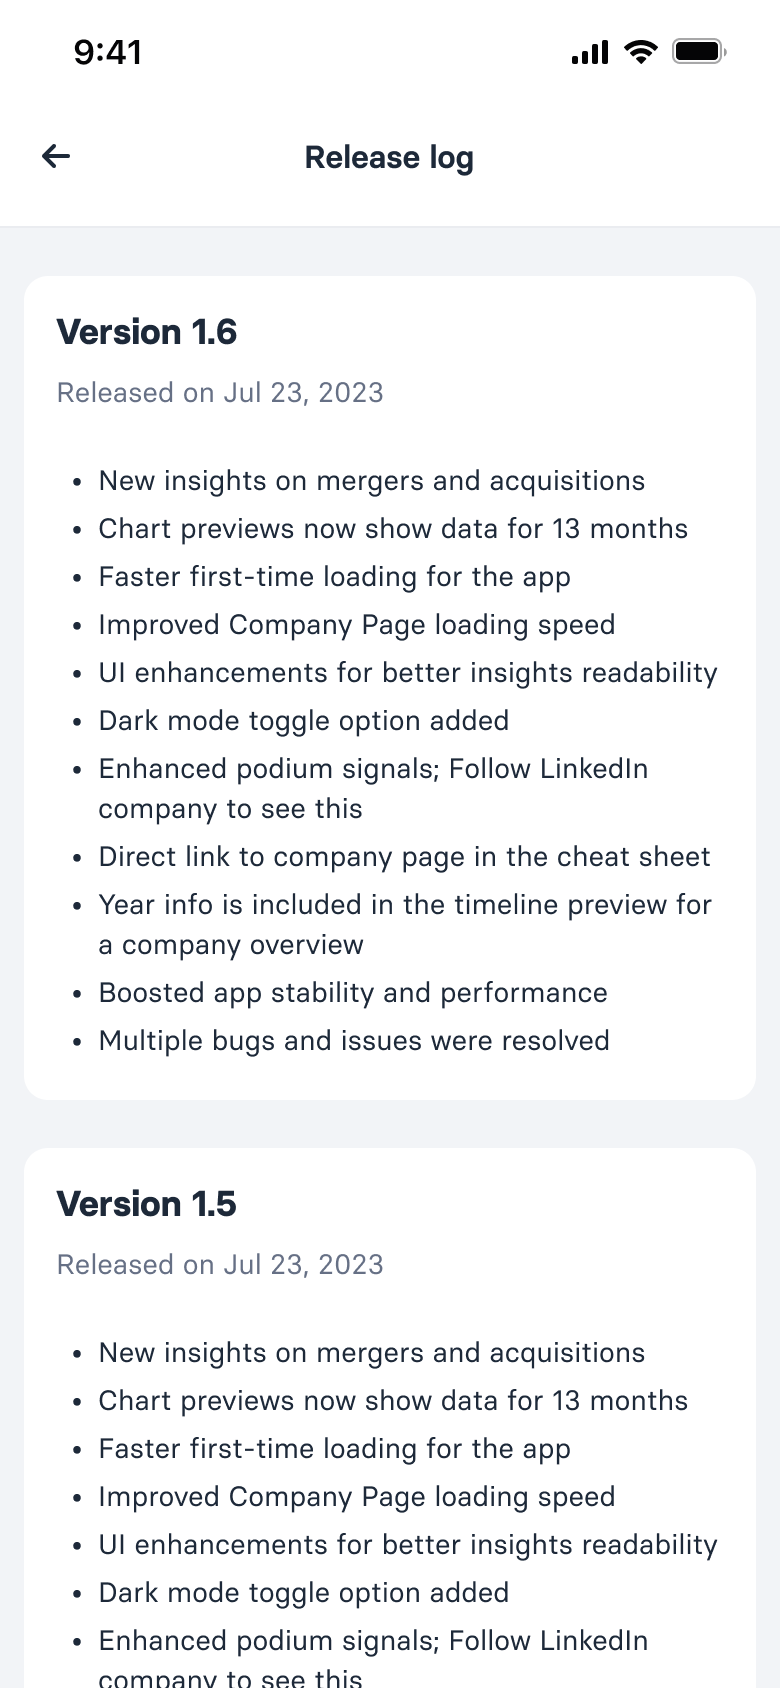
Release log listing each app version with its release date and the changes shipped in it
Settings
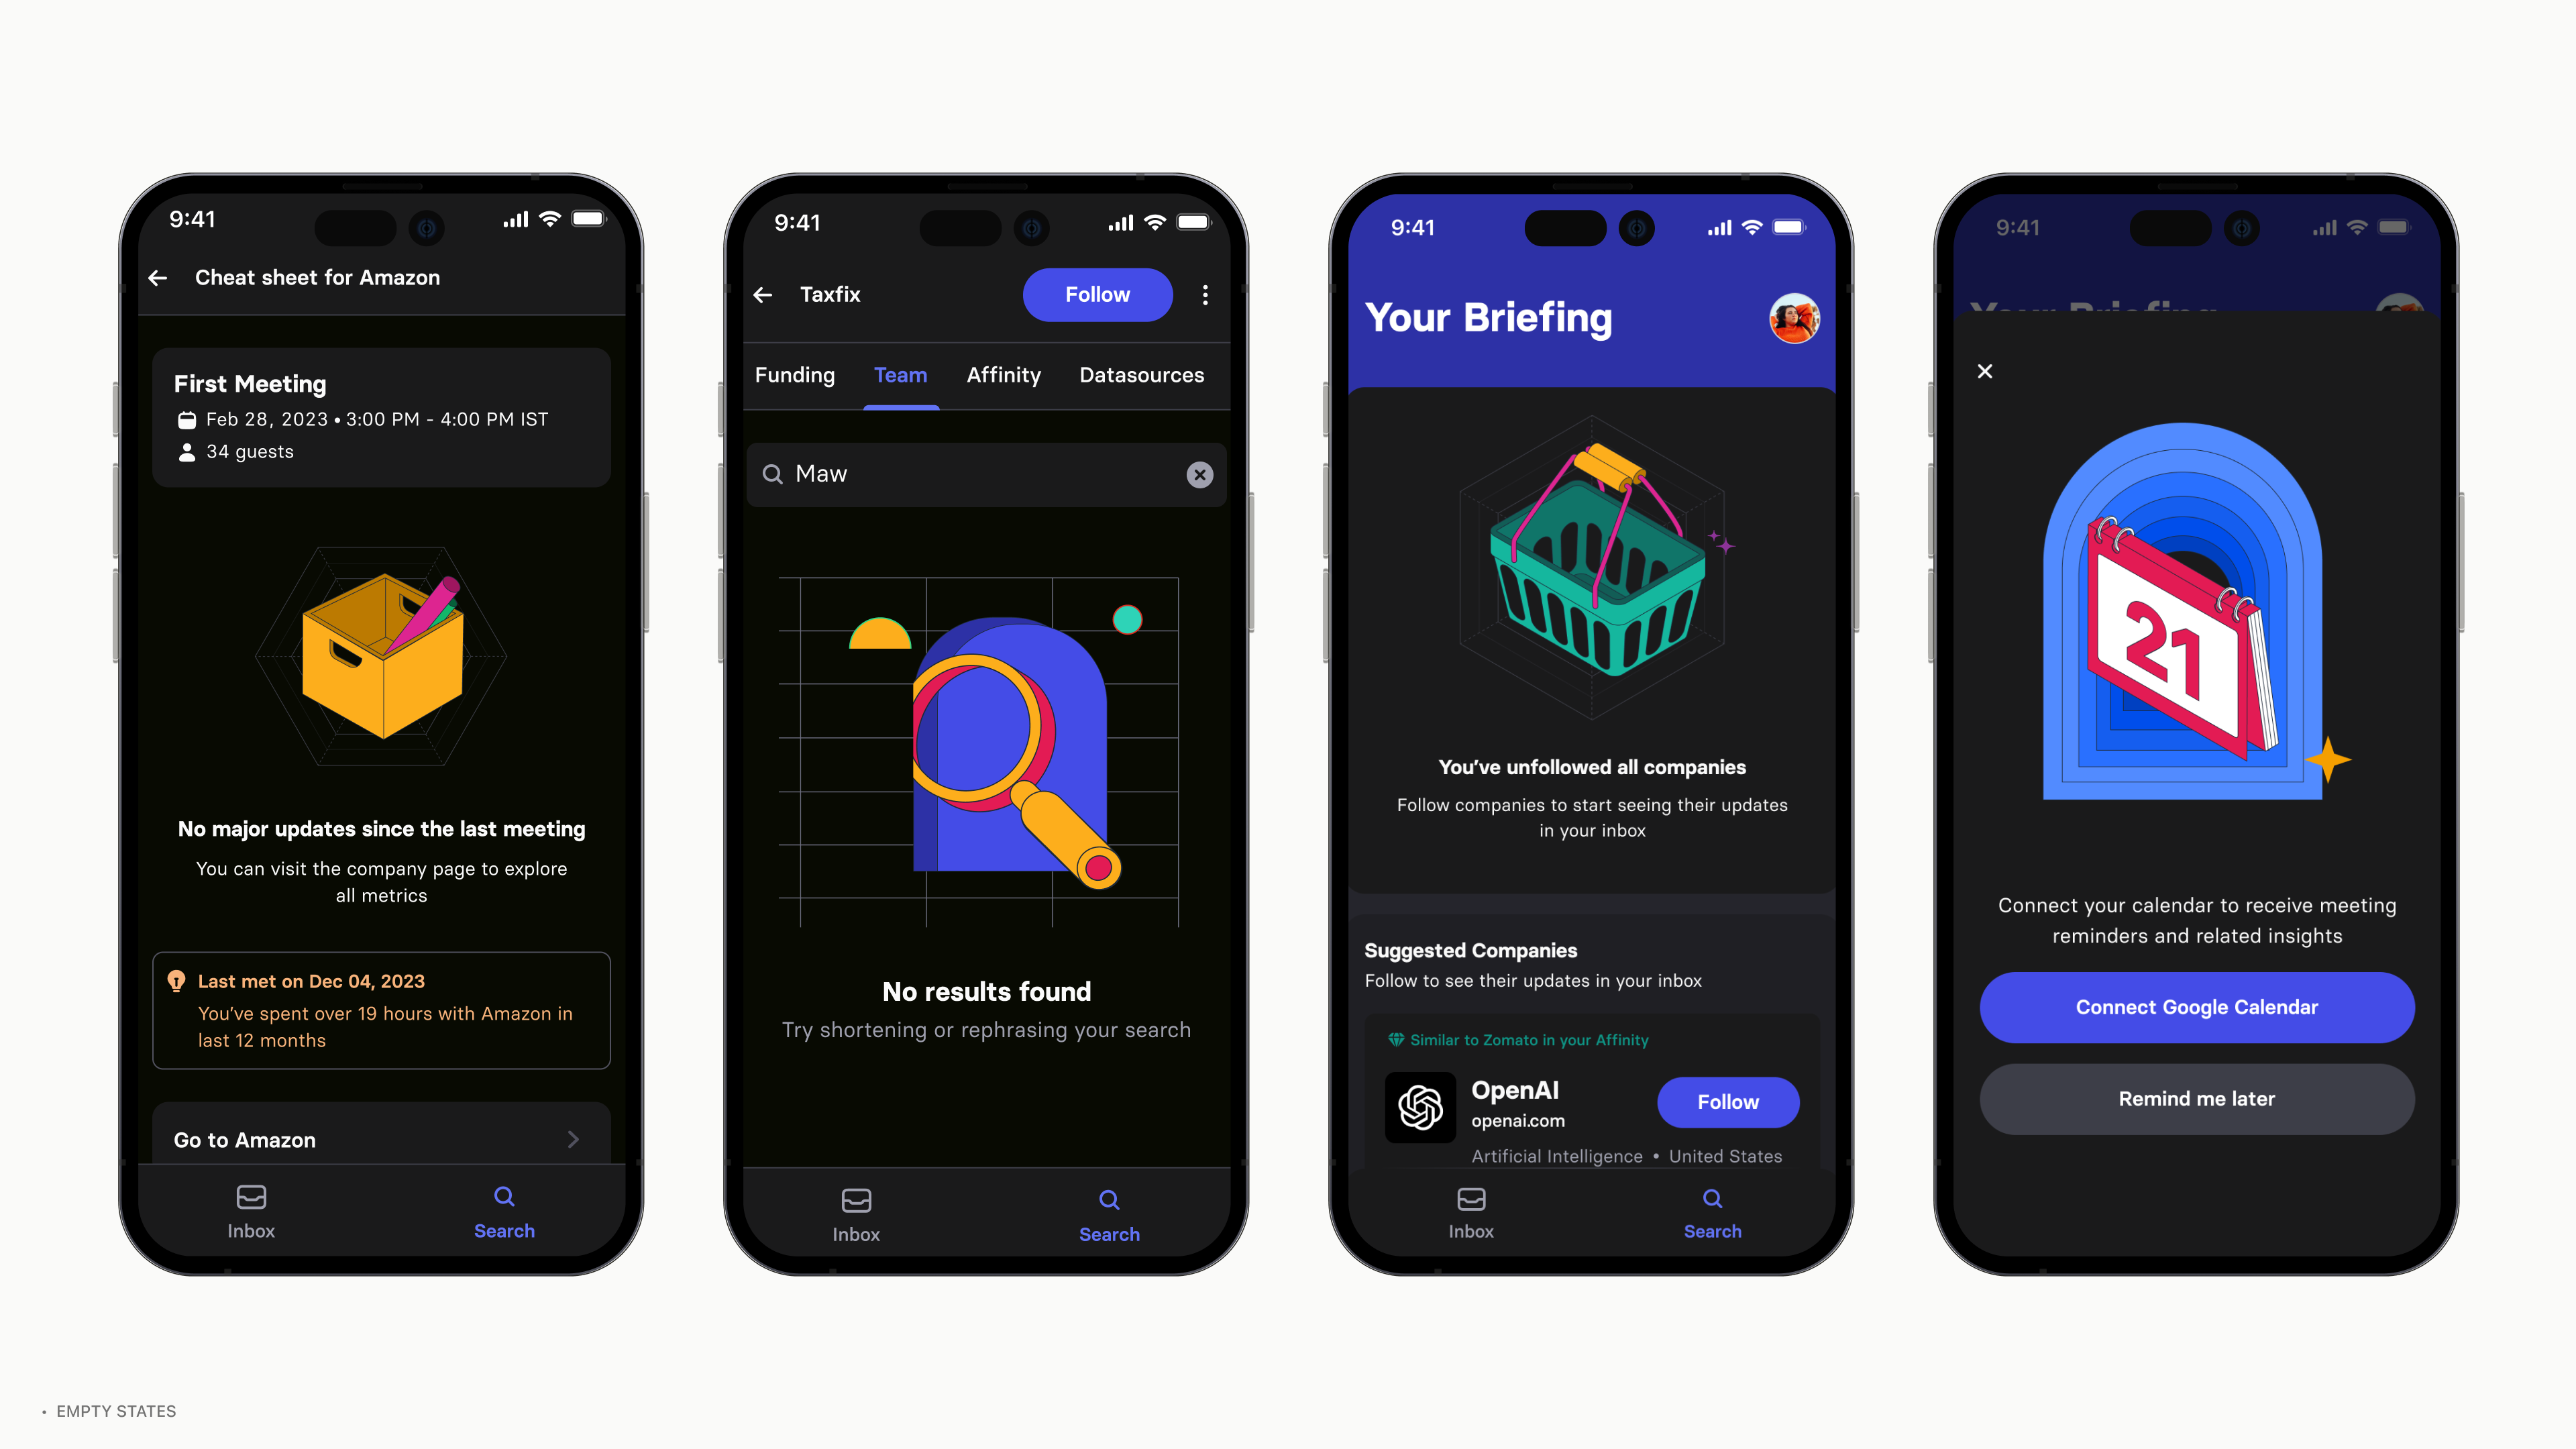
Empty states across the app: no major updates since the last meeting, no search results found, you have unfollowed all companies, and a prompt to connect Google Calendar