Derived Metrics: letting VCs build their own metrics on top of existing data
A framework that lets investors define custom metrics, like Rule of 40 or Revenue per Employee, from simple arithmetic formulae, so they behave exactly like any other metric across the tool.
At a glance
Two phases of the same system, built for two different users. V1 let one investor write one formula on one company. V2 scaled that to an internal ops team standardizing metrics across 150+ companies.
| V1 (Shipped) | V2 (Shipped) | |
|---|---|---|
| Who it's for | External investor customers | Internal PortfolioIQ ops teams (ingestion, finance, portfolio ops, admins) |
| Formula language | Arithmetic only (+, −, ×, ÷), time refs t-2 … t+2 | + Conditionals (IF/THEN/ELSE, EXISTS), granularity-scoped fallbacks, derived-to-derived chaining (depth 5) |
| Computation engine | Flat evaluation, SUM-default roll-up | Dependency-graph execution, derived metrics participate in roll-ups, per-period failure diagnostics |
| Trust & edge cases | Overflow / div-by-zero / unresolvable states, cycle detection | Cycle detection extended to conditional branches (conservative by design) |
| Rollout | One formula, one company, one investor | Bulk creation (GDMT): an admin defines once, then it resolves org-wide across every company |
| Research | 3 independent signals: customer ask, internal usage research, competitive teardown | Structured stakeholder design sessions, skipping fresh research on purpose since V1 had already validated the need |
Key product decisions
Four calls shaped this system more than any single screen, each taking on cost or risk on purpose.
| Decision | Trade-off accepted | Why it paid off |
|---|---|---|
| Structured metric references, not formula strings | Heavier data model at V1, before V2's needs existed | The highest-leverage call in the project. Remapping, derived-to-derived chaining, and GDMT resolution were all cheap later instead of redesigns |
| Block-based tokens over free text | Less flexible than raw text; V2 had to extend the same token model | Carried through both versions without a redesign |
| Text-based editing over a visual node canvas (V2) | Rejected the more novel-looking solution every time it came up | Scored across all 23 V2 stories, text won on all three axes: associates are power users, not casual dabblers |
| Bulk creation sequenced as its own phase | Admins waited longer for V2's highest-leverage capability | Shipped once conditionals and graph execution were proven, instead of compounding two kinds of risk at once |
1Why derived metrics needed to exist
Analysts and VCs don't just consume the metrics a company reports. They build their own on top of them: Rule of 40, Revenue per Employee, sector-specific ratios like RASM for airlines. PortfolioIQ had no way to let someone define one of these and have it behave like a native metric: chart it, roll it up, trust it. So that math happened in spreadsheets outside the tool, at the exact moment we should have been most useful.
Why it mattered: two signals made this a priority, not a nice-to-have. Greenoaks asked for it directly. Their team was already computing metrics like this outside PortfolioIQ. And internal usage research traced almost every analyst question back to the same root: how is this company actually performing? That question nearly always meant combining two or more raw metrics.
2Use cases & research validation
A customer ask and internal usage research both pointed the same way. The third signal was a competitive teardown, to check whether the market had already converged on a shared mental model, and how much interaction-design risk we were taking on.
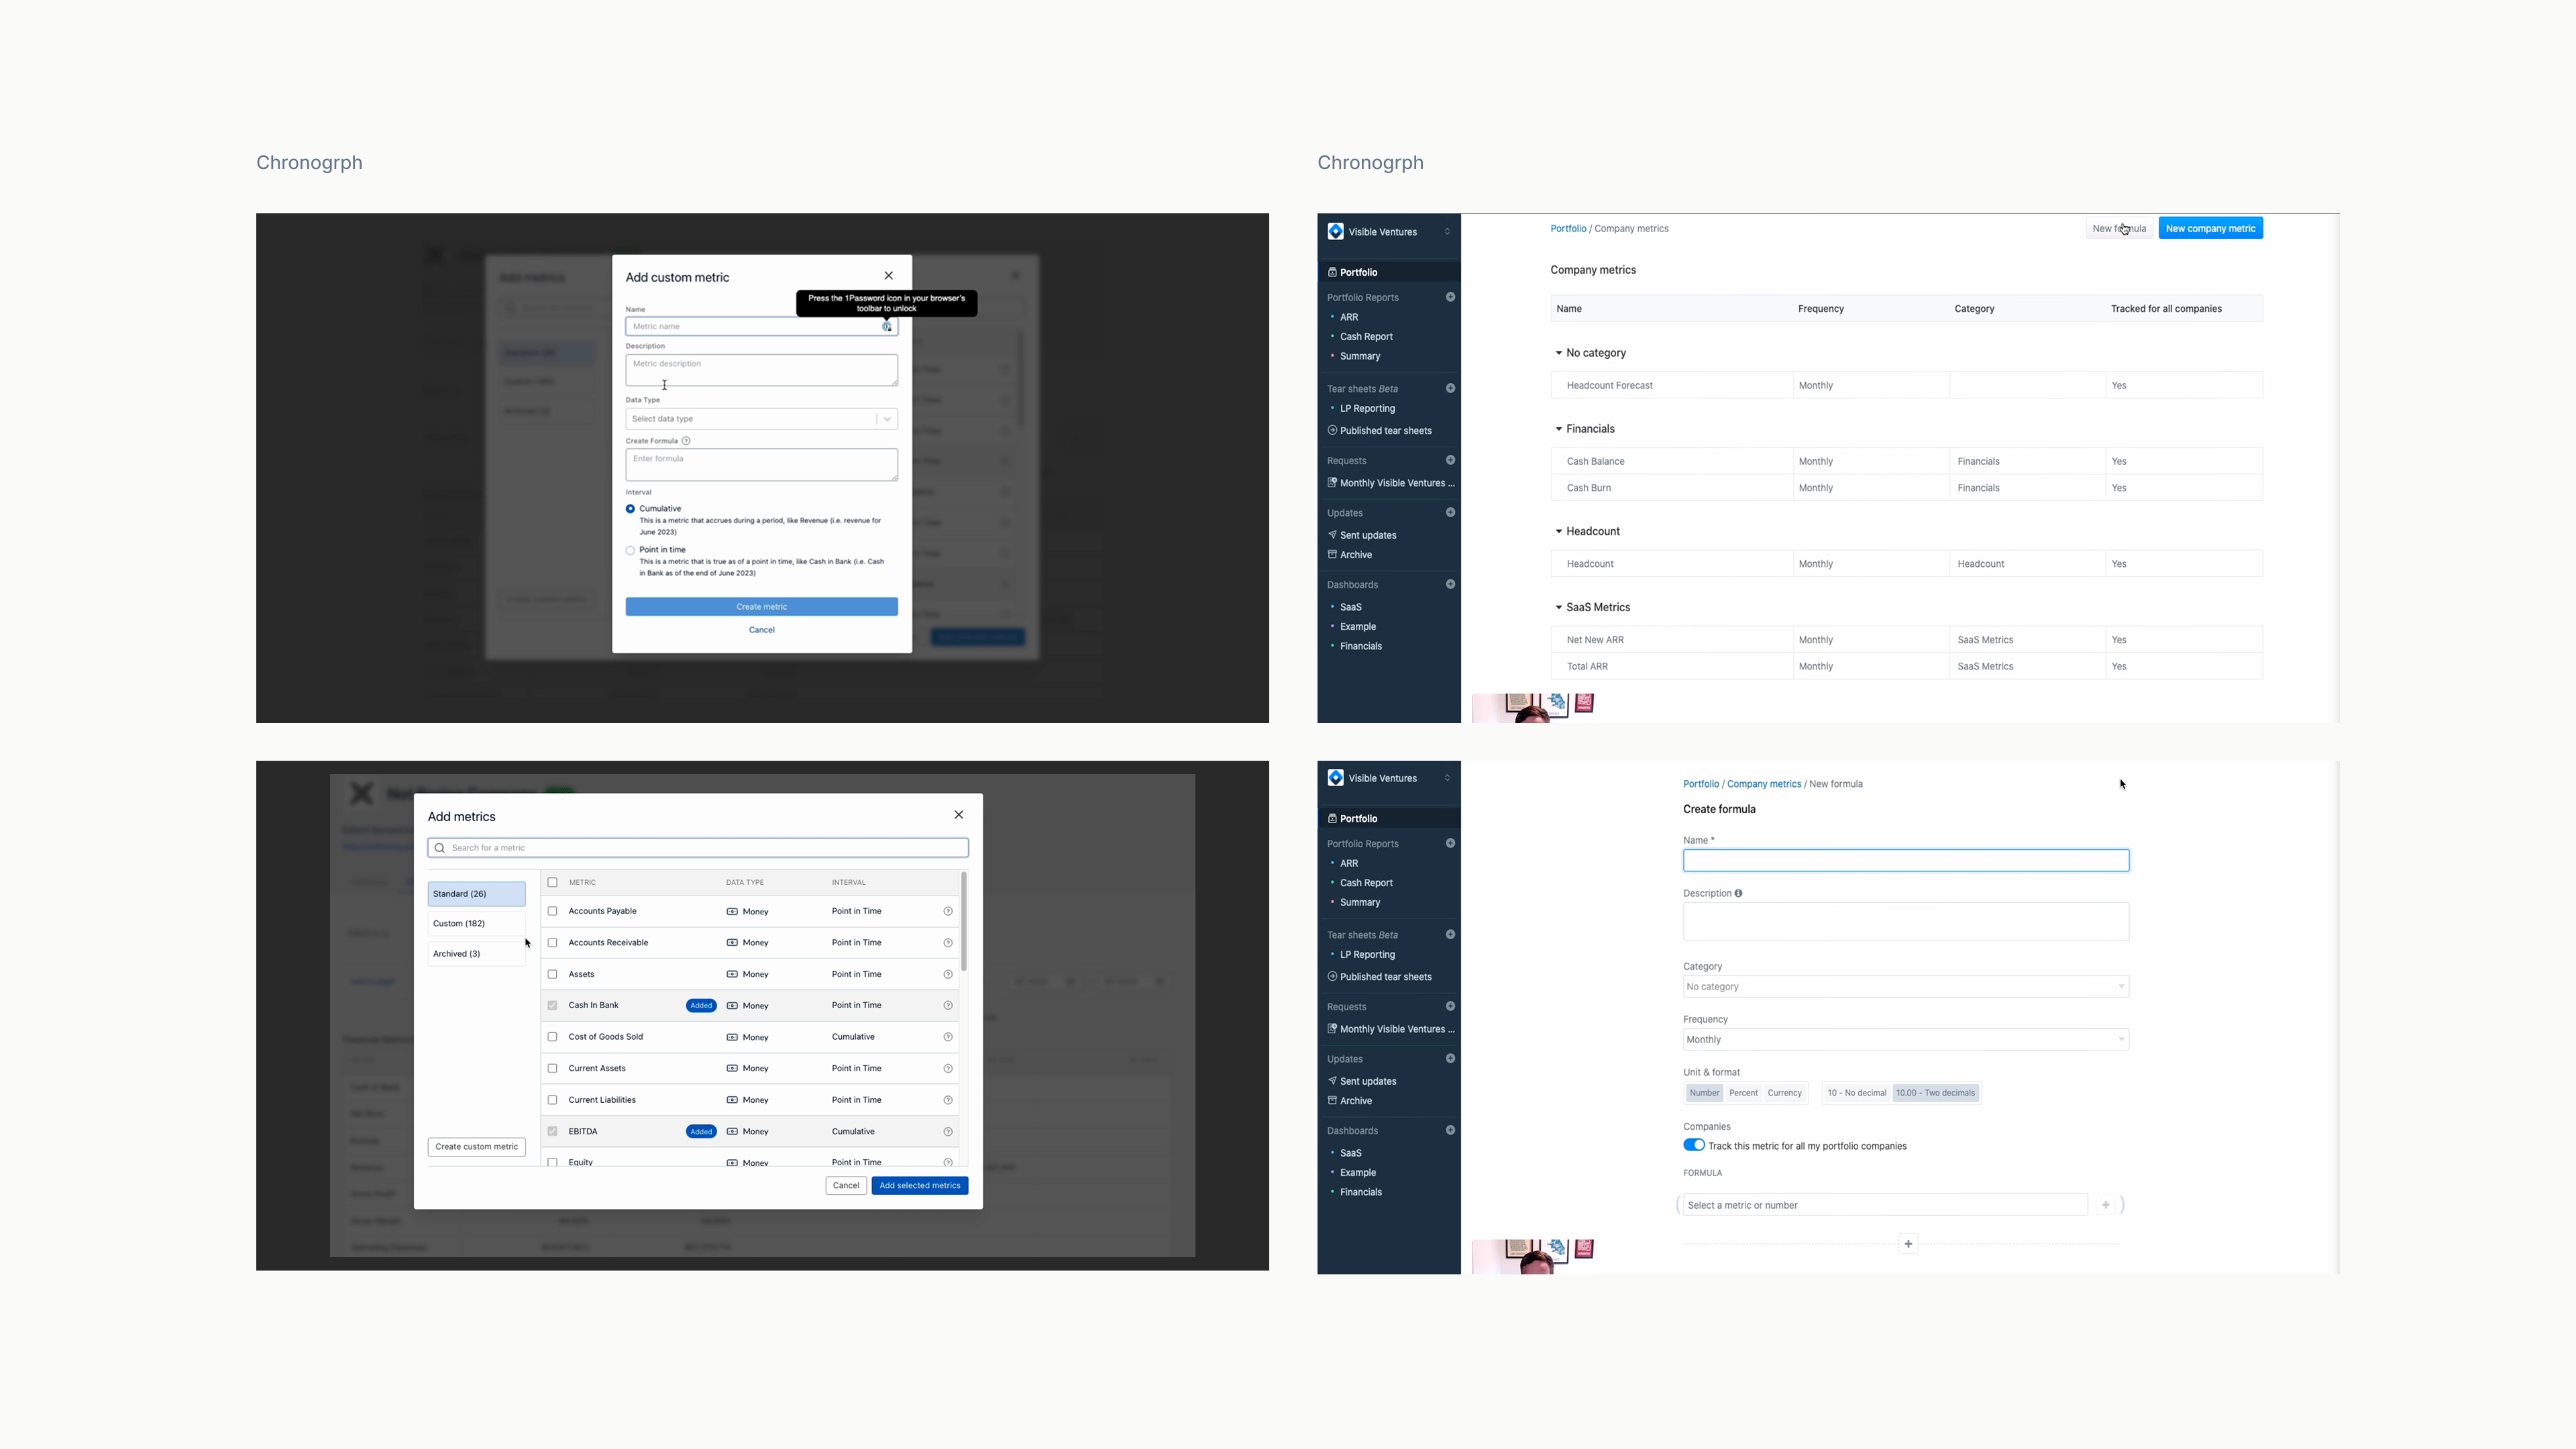
Concrete use cases we validated against, spanning sector-specific and cross-sector needs, so the design targeted a general arithmetic engine rather than a handful of hardcoded formulas.
| Use case | Who needs it | Formula |
|---|---|---|
| Rule of 40 | SaaS investors judging growth vs. profitability | ARRGrowthRate[t] + ProfitMargin[t] |
| PEPM (per employee/month) | HRMS investors benchmarking unit economics | Revenue[t] / Headcount[t] / 12 |
| RASM (revenue/seat mile) | Airline investors comparing efficiency | Revenue[t] / AvailableSeatMiles[t] |
| Revenue per employee | Cross-portfolio efficiency comparisons | Revenue[t] / Headcount[t] |
| Custom growth index | Firms with proprietary scoring models | (ARRGrowthRate[t]*0.6) + (HeadcountGrowth[t]*0.4) |
One story, building analyses on custom metrics, was explicitly descoped for v1. I designed the data model so that door stays open, without paying its cost now.
3What made it hard: designing the formula builder
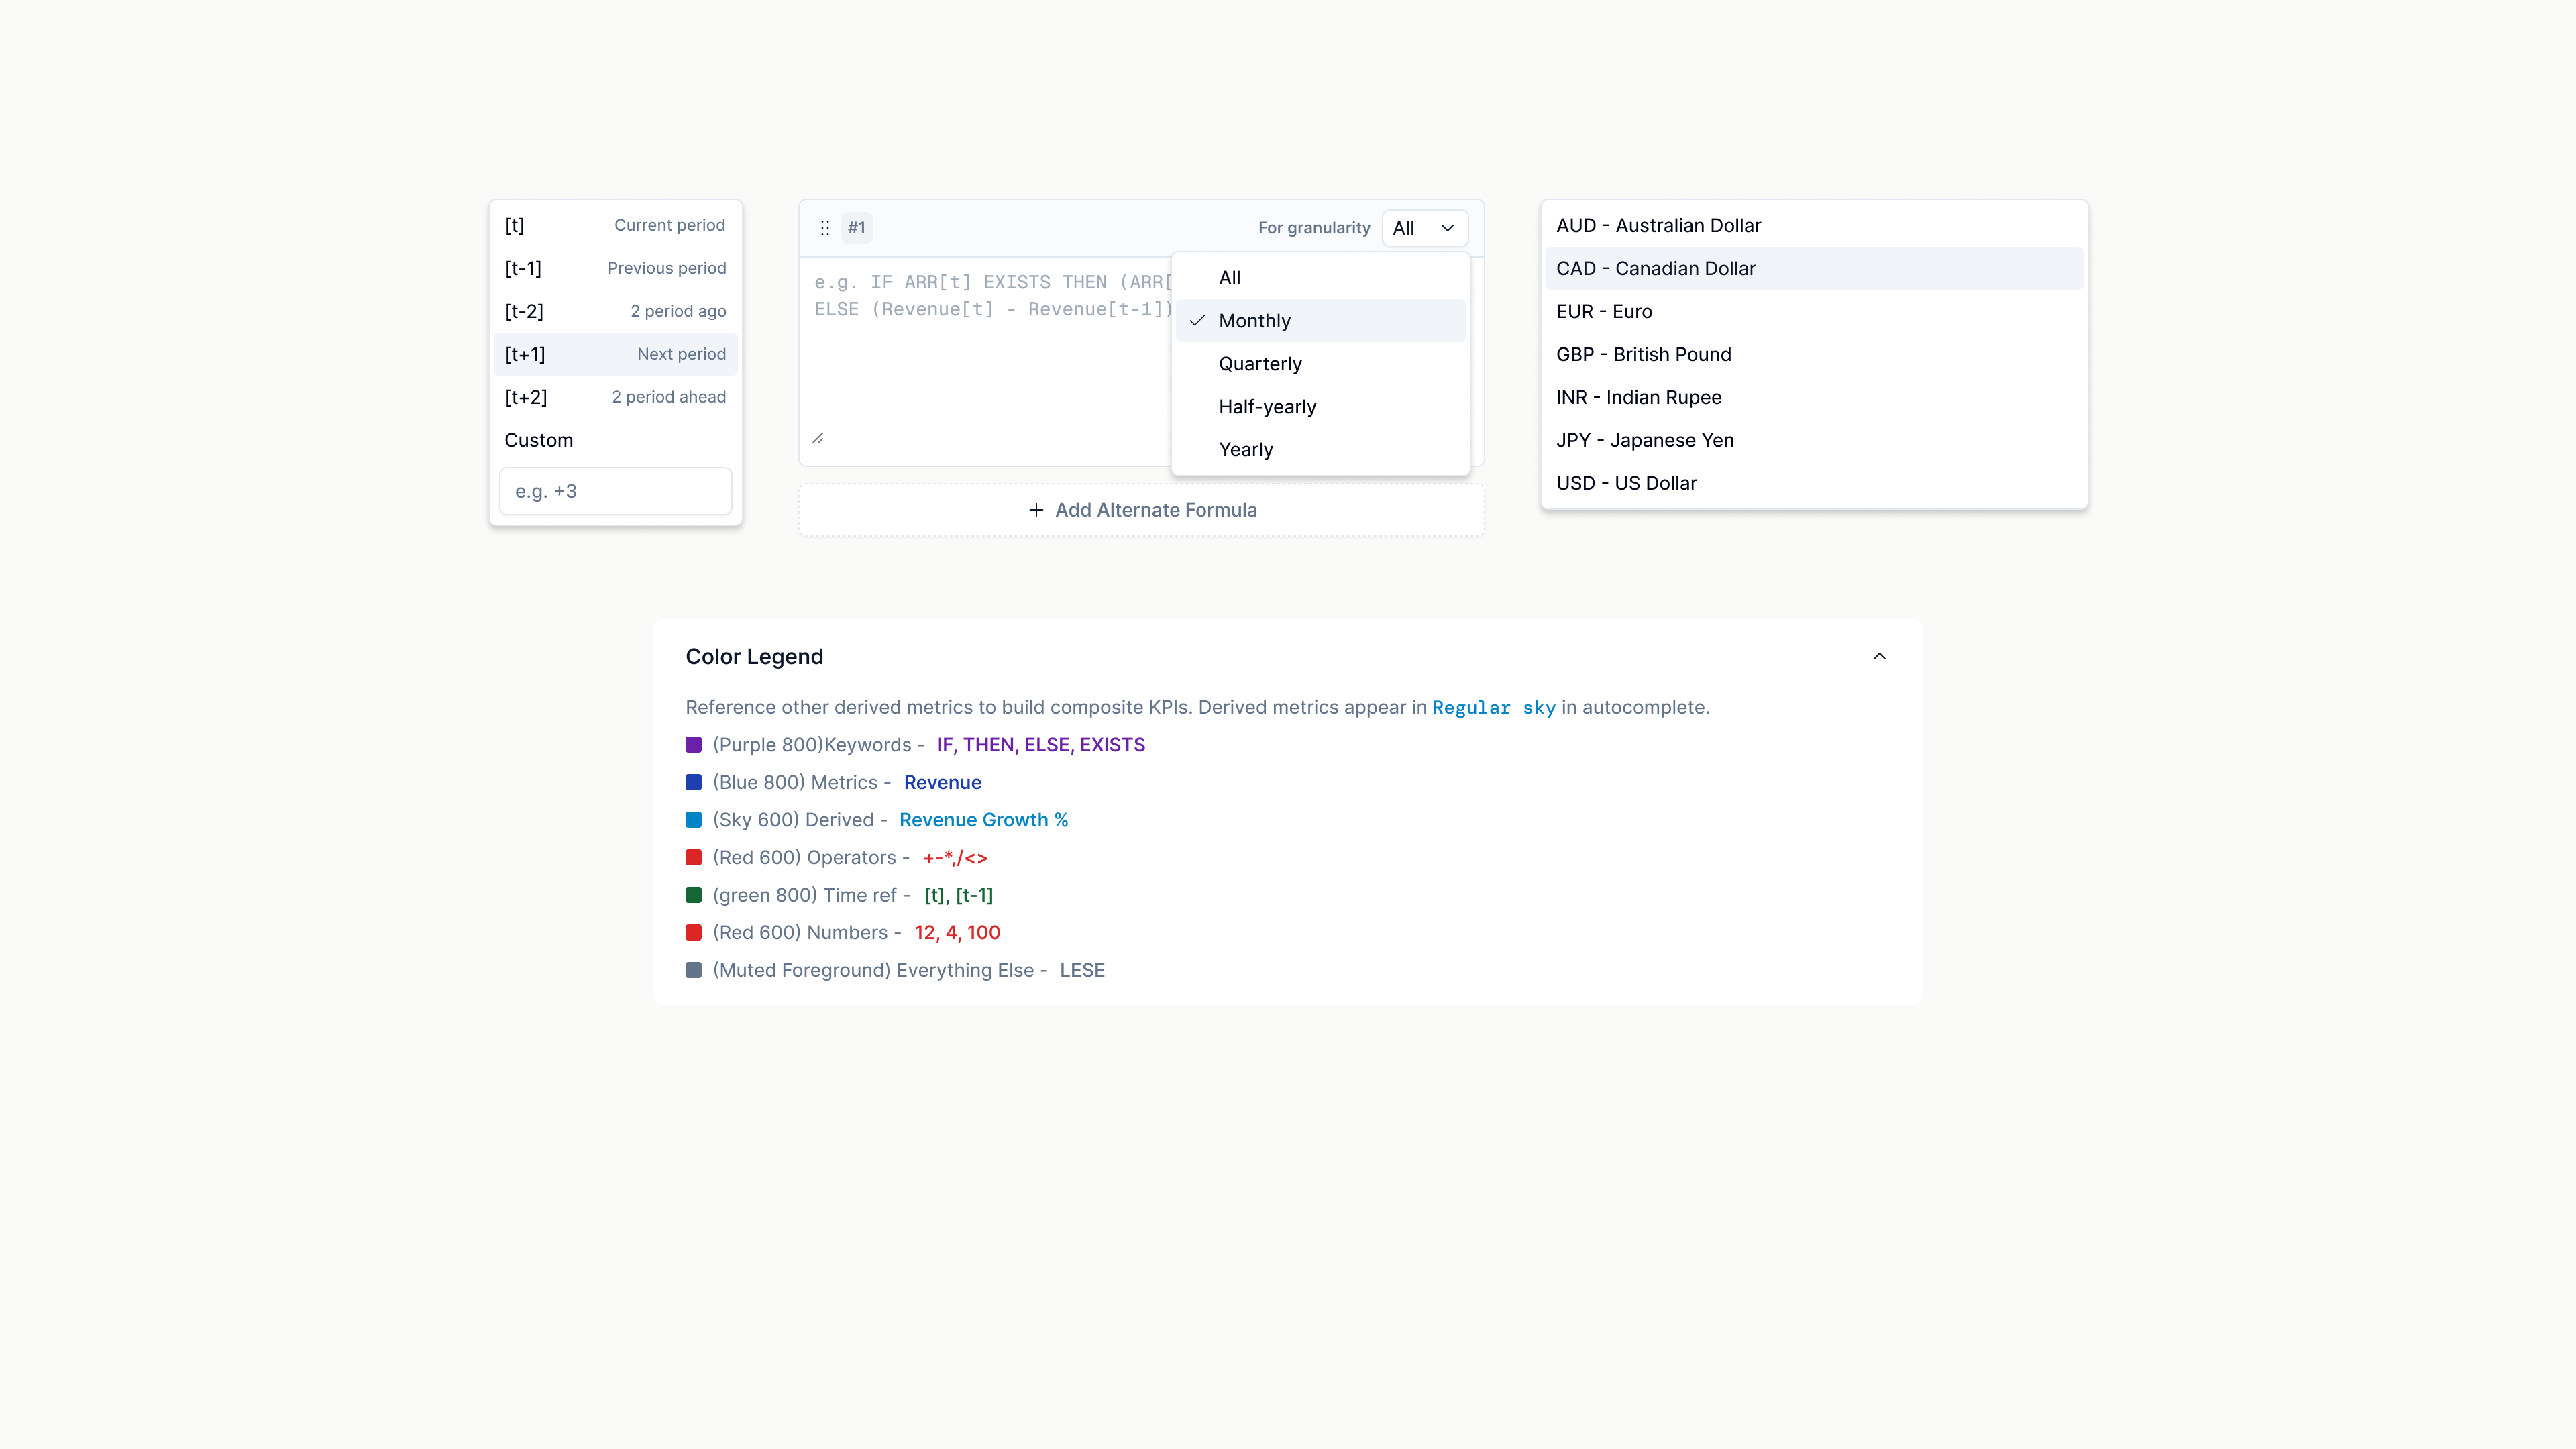
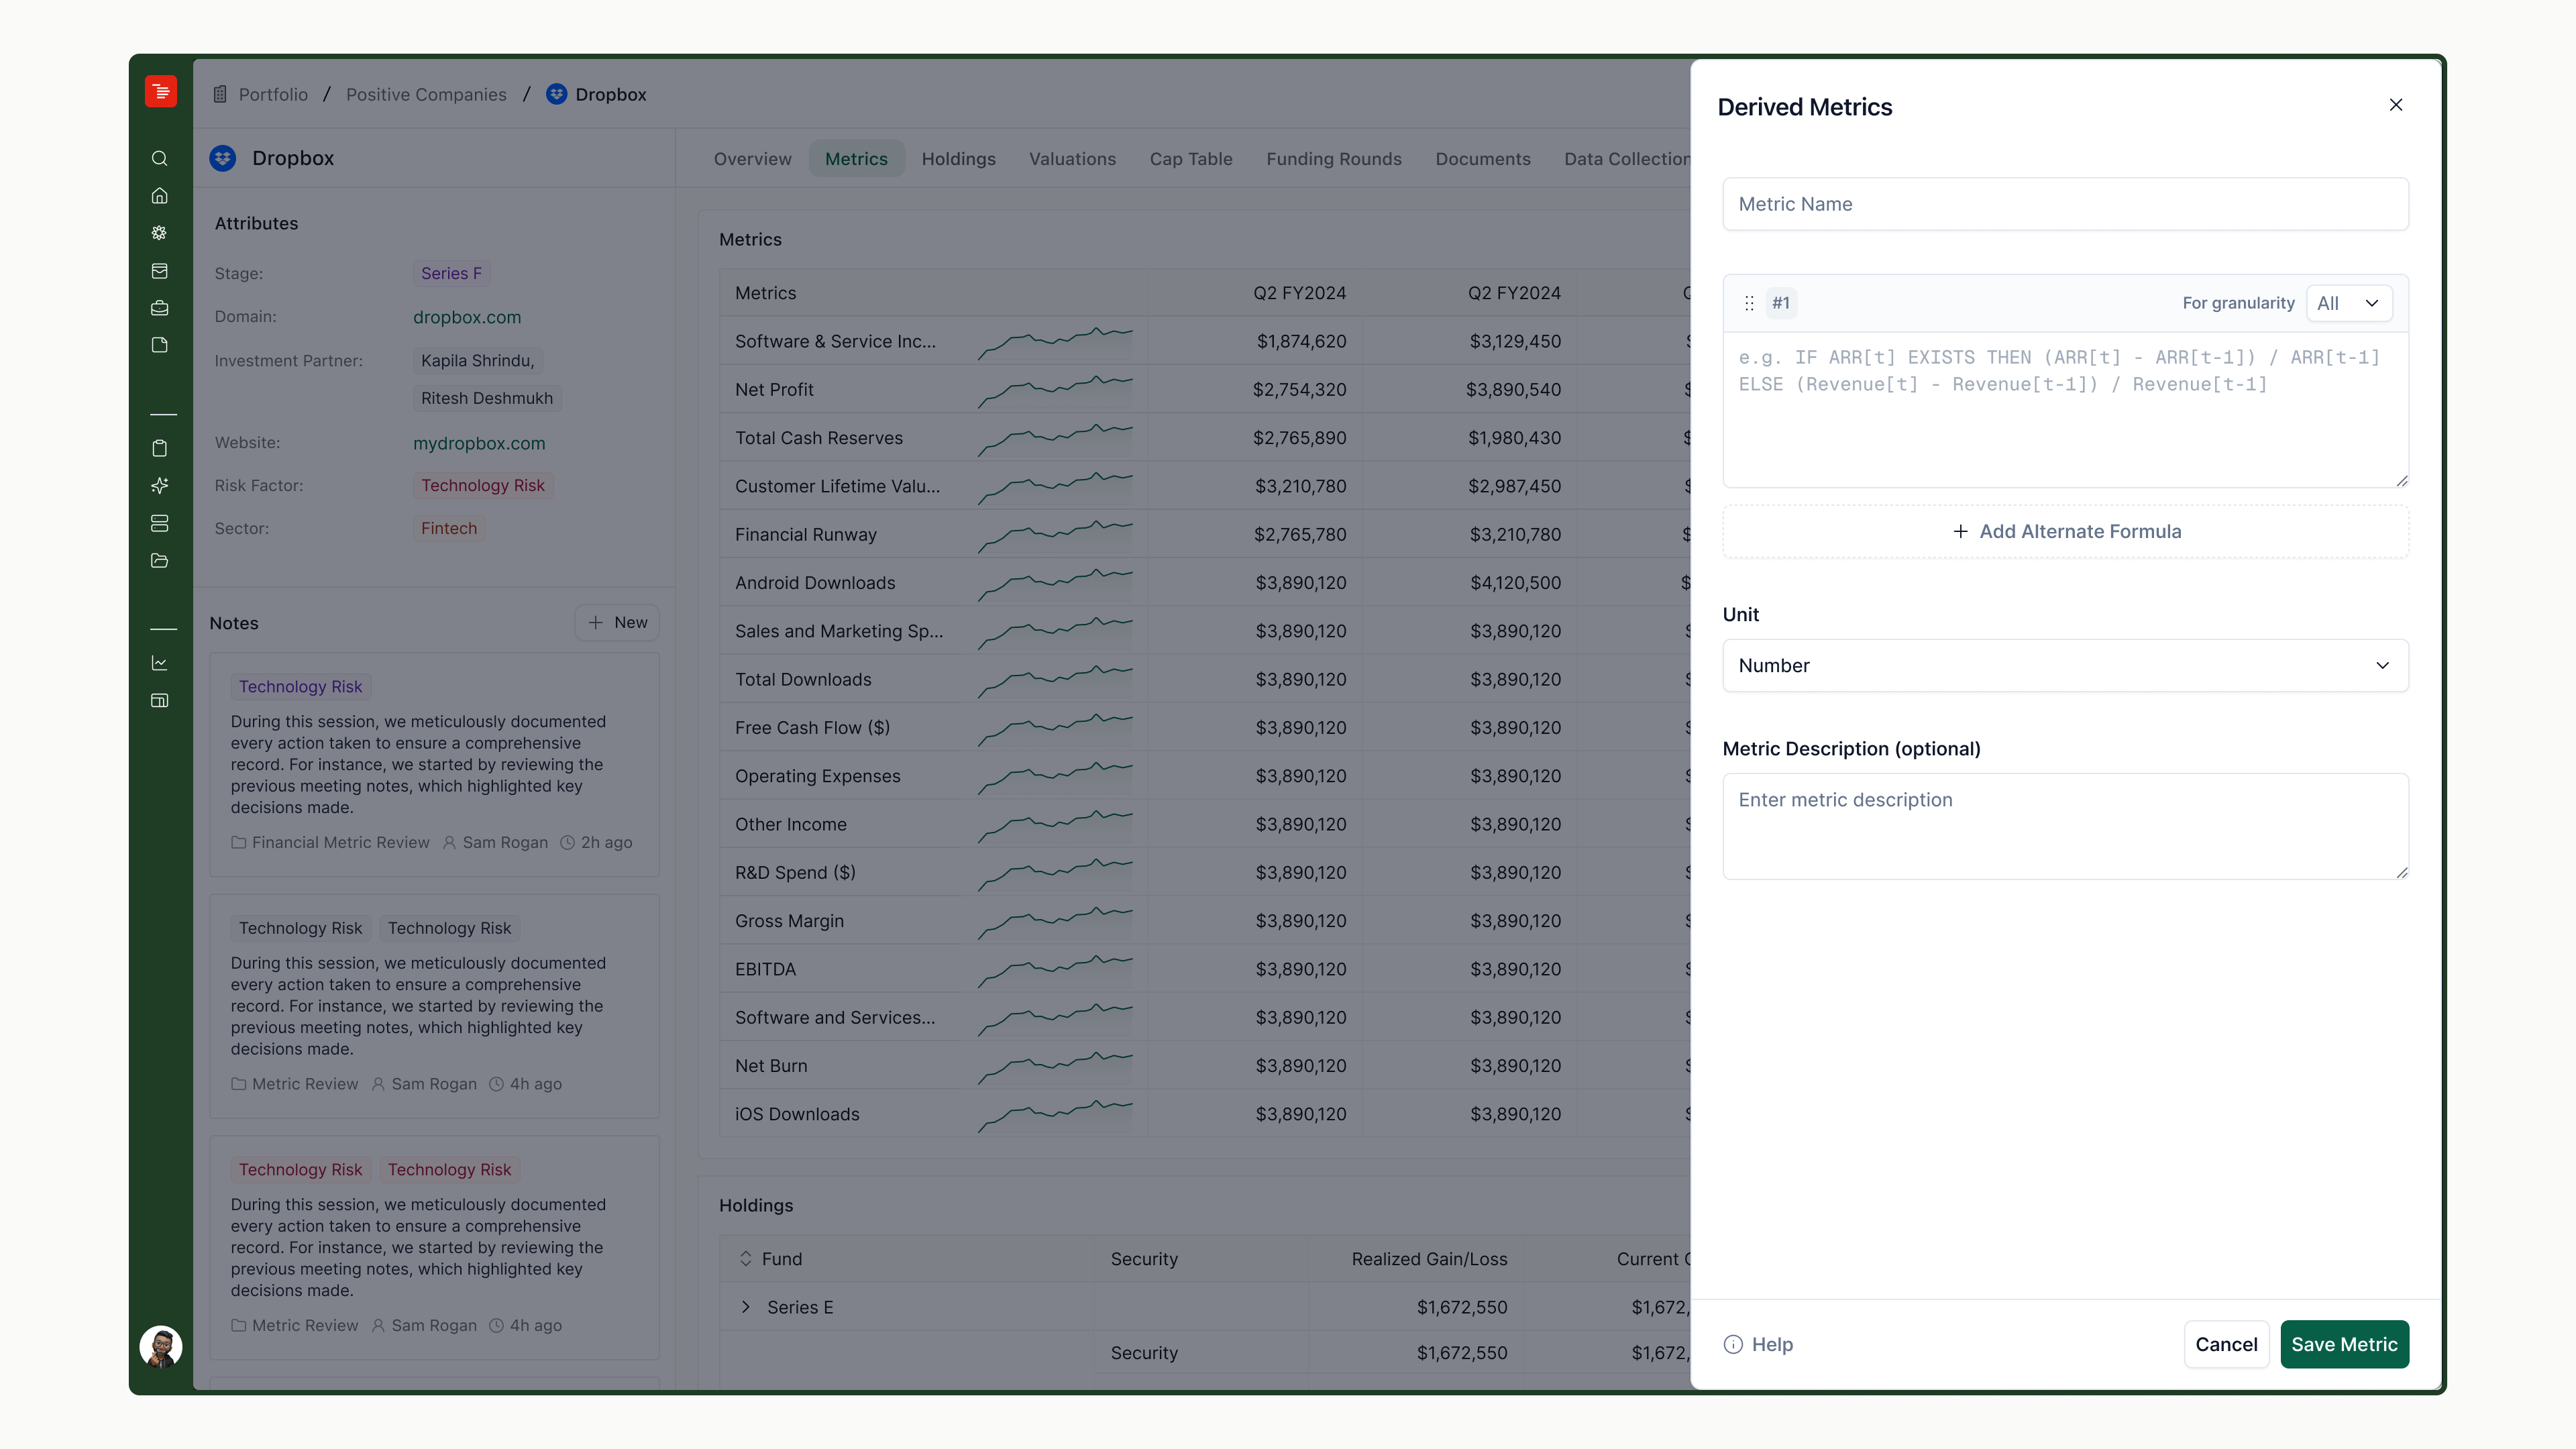
The riskiest part of this feature wasn't the math. It was making formula entry feel safe for a non-technical, deadline-driven user. Free-text input invites typos and silent errors, so the design leans on constrained, block-based input instead.
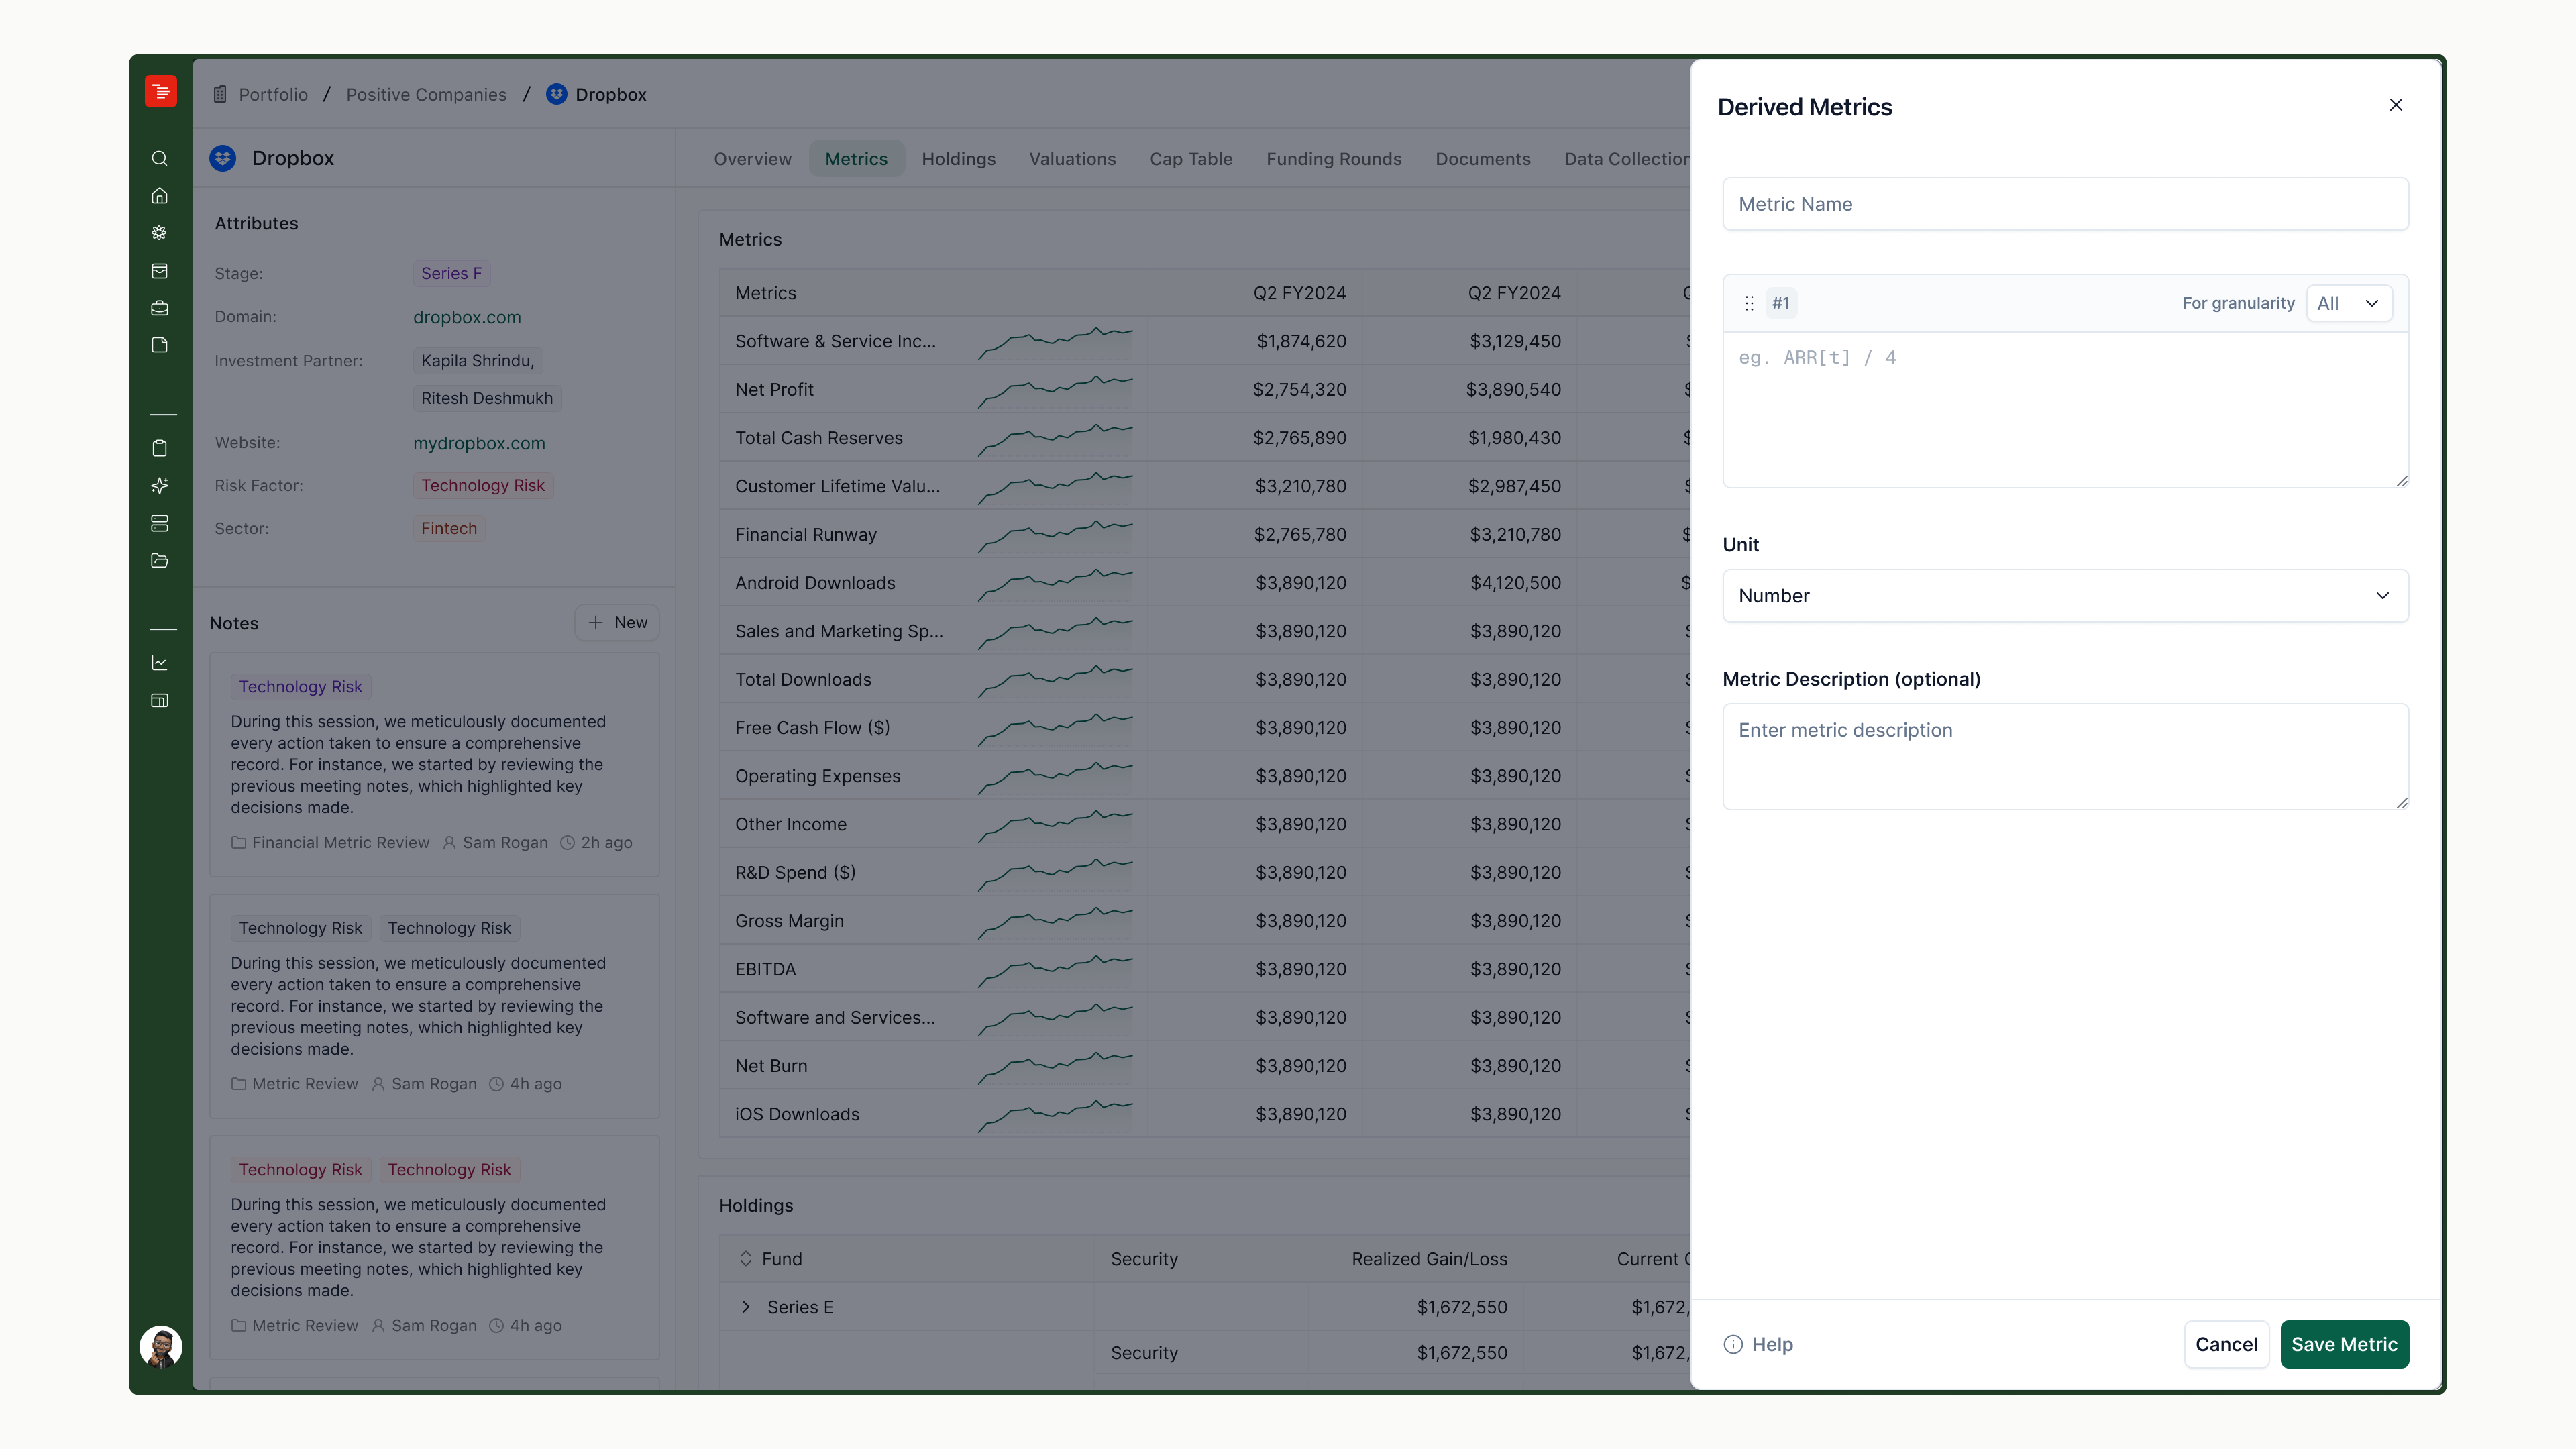
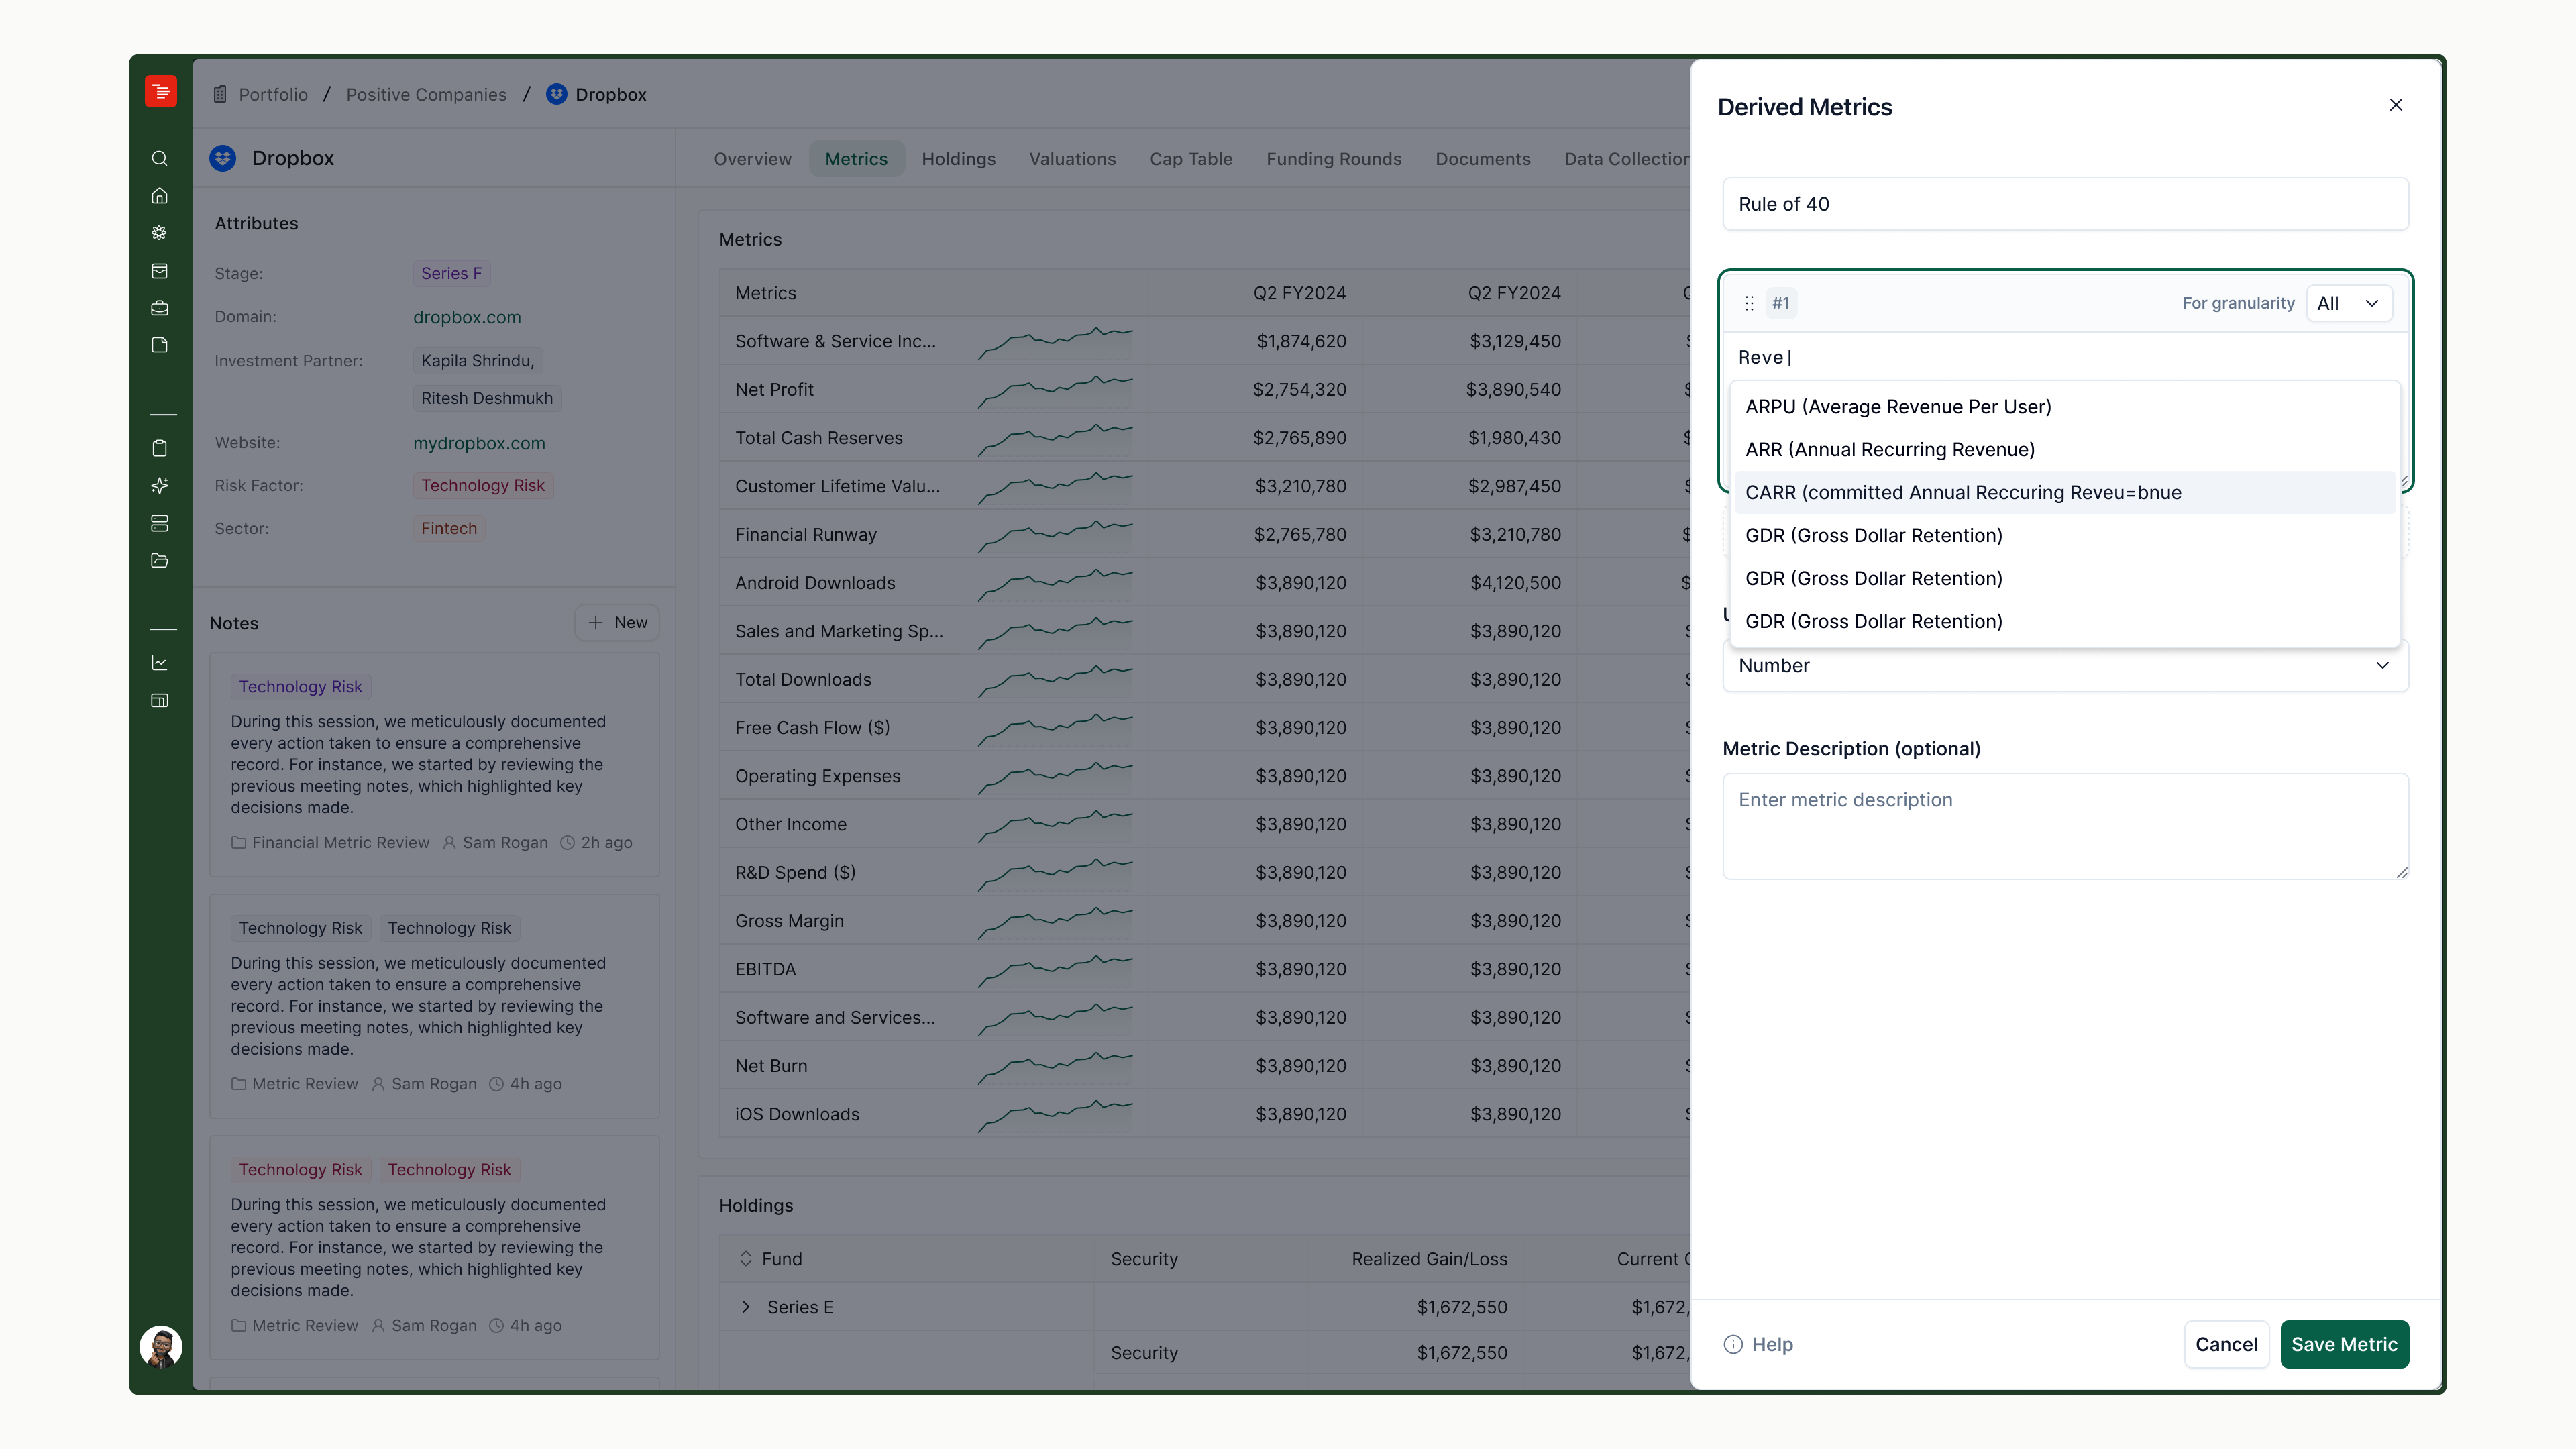
Simple valuation   = ARR[t] * 4
Rule of 40         = ARRGrowthRate[t] + ProfitMargin[t]
4The part I owned: edge cases and computational trust
Once users chain formulae on top of formulae, the real design work stops being about the happy path. I owned the states below, and closing them was a gating item before engineering could build.
Overflow
Division by zero
Unresolvable
Each state gets its own compact cell plus an explanatory tooltip, so a user scanning a table full of derived metrics can tell "genuinely zero" apart from "broken" apart from "too large to be meaningful," at a glance.
Cyclic dependency prevention
Derived metrics can reference other derived metrics, so the system needs a strict evaluation order and must actively reject formulas that would create a cycle. I treated this as a validation-time problem, not a runtime one: saving a formula runs a dependency check and blocks with a clear explanation, rather than saving it and failing silently at computation time.
A = B + 10
C = A - 2

// Editing A to reference C creates a cycle:
A = B + 10 - C     → rejected: A depends on C, which depends on A
Formula integrity under mapping changes
If B in A = B + C gets remapped to D during tagging, the formula must update to A = D + C automatically. Otherwise a derived metric silently points at the wrong data. This is the practical payoff of storing formula dependencies as structured references rather than strings: a remap becomes a reference update, not a find-and-replace.
5Where it shows up, and what changed
Derived metrics surface everywhere a native metric does: the all-metrics list, the metric detail page (sibling-metric context plus a live-substitution tooltip), and an equivalent Admin UI. Deliberately excluded from v1: the tagging tool and custom analyses, scoped out to ship faster with a data model built so neither is a rewrite later.
60% adoption in one release with no marketing push means the feature reached past its original requester to become a default workflow. And 12–13 metrics per org means firms aren't creating one-off formulas and stopping, they're standardizing on a set, exactly the behavior the usage research predicted.
6What this taught me going into V2
The hardest part wasn't the formula UX. It was resisting scope creep toward "let users write any function," and constraining hard to arithmetic-only, block-based input instead. That constraint is what made the error states, cycle detection, and mapping-safety guarantees tractable in one release rather than an open-ended research project.
1Why a V2: from "one investor, one formula" to an org-wide engine
V1 answered a narrow question well: can one investor define one arithmetic formula on one company? Usage exposed a harder problem underneath. The teams who ingest and standardize data across 150+ portfolio companies were hitting the same ceiling: one static formula, no conditionals, no per-granularity logic, no way to define a metric once and roll it out everywhere.
V2 is a three-pillar upgrade to the same system: a richer formula language (conditionals, granularity scoping, derived-to-derived chaining to depth 5), a more capable computation engine (roll-up participation, dependency-graph execution, granular error reporting), and a bulk creation system sequenced deliberately as a later phase, once the first two hardened. All three have since shipped.
2The problems V1 couldn't solve
Five internal personas, one recurring pattern: doing it in Excel because the tool can't. Grouped by who was affected rather than by feature area, since the same missing capability shows up as a different problem depending on who hits it.
| Persona | Pain point | Root cause |
|---|---|---|
| Associates & Analysts Data Ingestion | Track "which company reports what" in a side spreadsheet; wrong annualization on one granularity; Rule of 40 computed in Excel and re-uploaded | No conditional fallback (Revenue→ARR); one static formula per granularity |
| Finance Team Middle Office | Fund/portfolio aggregates rebuilt by hand every reporting cycle | Derived metrics sit outside the roll-up engine entirely |
| Portfolio Operations KPI Tracking | Growth metrics and unit-economics ratios live in Excel with manual IF-guards; bespoke formula per company for Gross Margin % | No conditional logic |
| Partners & Principals Front Office | See composite benchmarks only in offline board decks, not dashboards; ad-hoc reconciliation requests | No derived-to-derived chaining; inconsistent per-entity setup |
| Organization Admins | Standards live in wiki pages with no enforcement; updating a formula means touching every company; no visibility into who's behind | No way to define a metric once and resolve it everywhere |
3Turning problems into a shortlist: the opportunity solution tree
With five personas and a wide spread of problems, the risk was solving each complaint in isolation. Instead, every user story went through the same discipline: propose 2–3 candidate solutions, score each on feasibility, desirability, and viability, then map survivors back to a small set of outcomes the whole tree needed to serve: eliminate spreadsheet workarounds, make derived metrics trustworthy and debuggable, and scale standardization without per-company toil.
| Candidate solution (US-007: referencing derived metrics) | Feasibility | Desirability | Viability | Verdict |
|---|---|---|---|---|
| Dependency graph visualizer with cycle warnings | Medium | High | High | Chosen: makes dependencies transparent before save, builds trust |
| Treat derived metrics identically in autocomplete | High | High | High | Chosen: near-zero cost, reuses the existing metric picker |
| Visual node-based composable canvas | Low (full new editing surface) | Medium | Low | Rejected: overlaps with the formula editor, high cost for marginal gain |
Run across all 23 stories, this consistently favored text-based editing over visual canvases, and pushed bulk creation out into its own follow-on phase rather than folding it into the core editor.
4Three pillars, concretely
1. Formula language expansion
Conditional logic is the headline addition: IF...THEN...ELSE with an EXISTS check for gap-filling.
Revenue (normalized) = IF Revenue[t] EXISTS THEN Revenue[t] ELSE ARR[t]
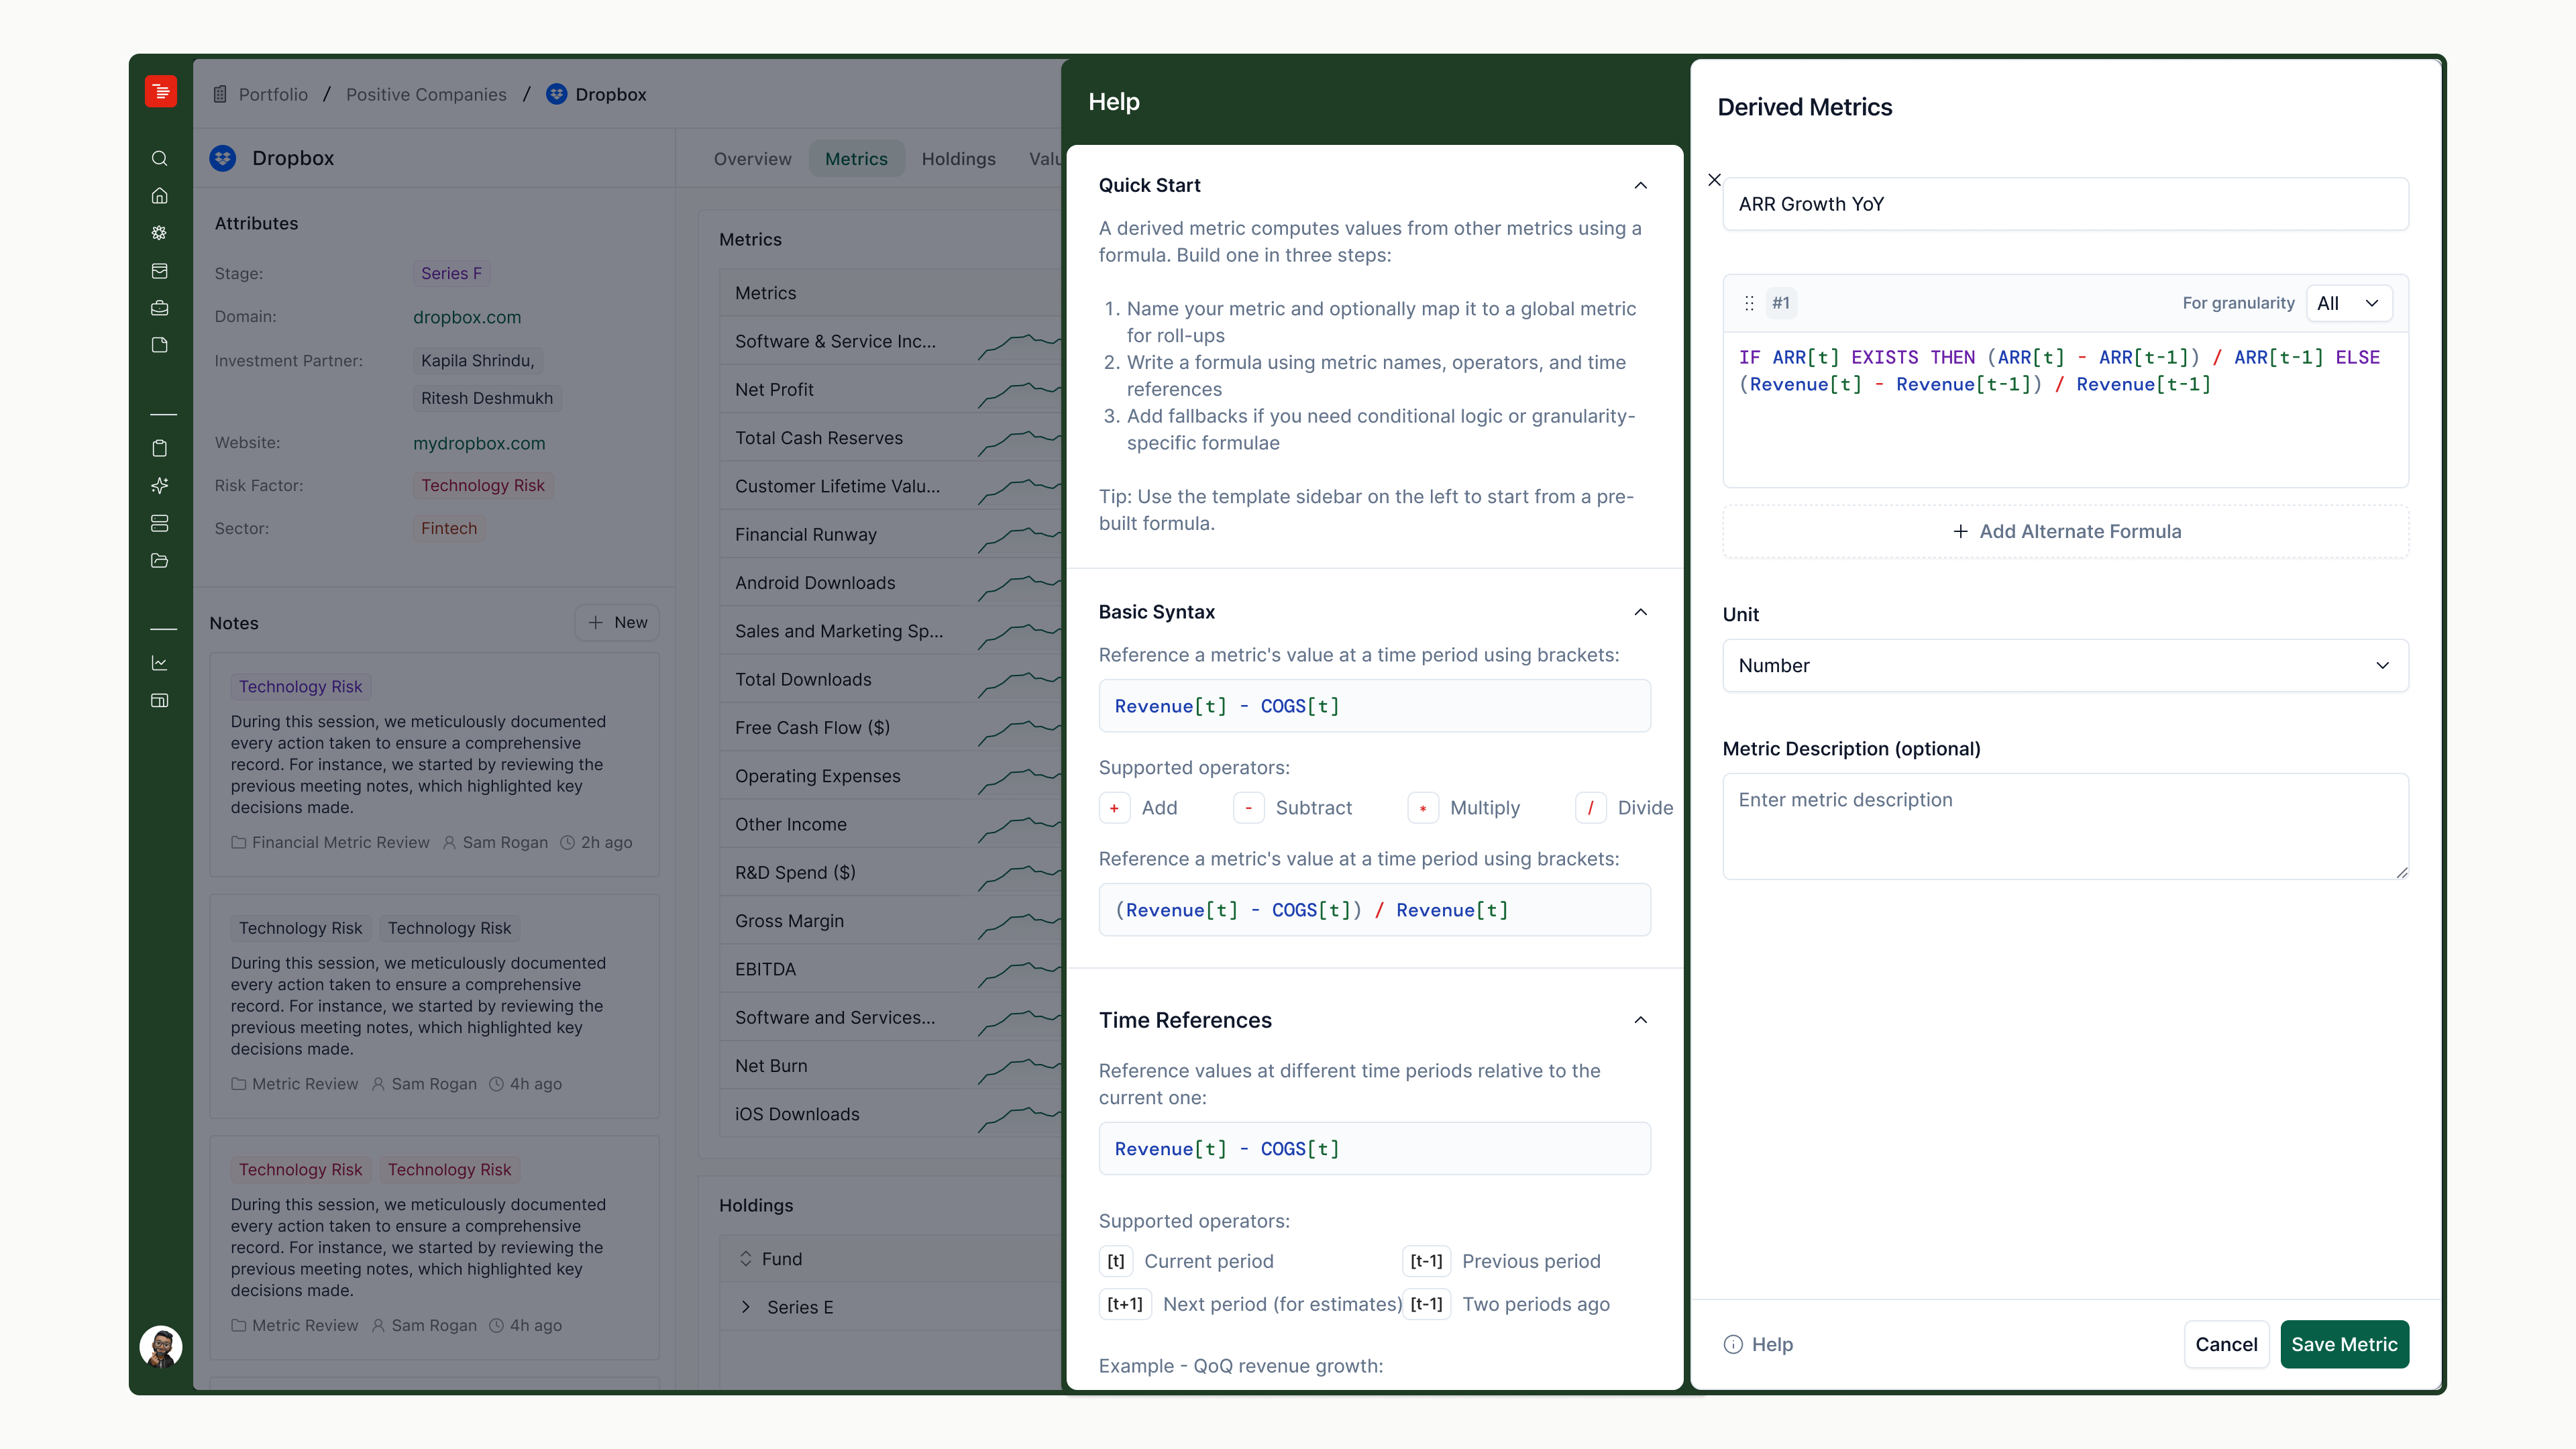
Granularity-scoped fallbacks solve the annualization problem directly. The same fallback chain now carries a different formula per granularity instead of one formula misapplied to all of them. And derived metrics can reference other derived metrics up to a dependency depth of 5, resolved via topological sort, for example Rule of 40 = RevenueGrowth[t] + EBITDAMargin[t], where both inputs are themselves derived.
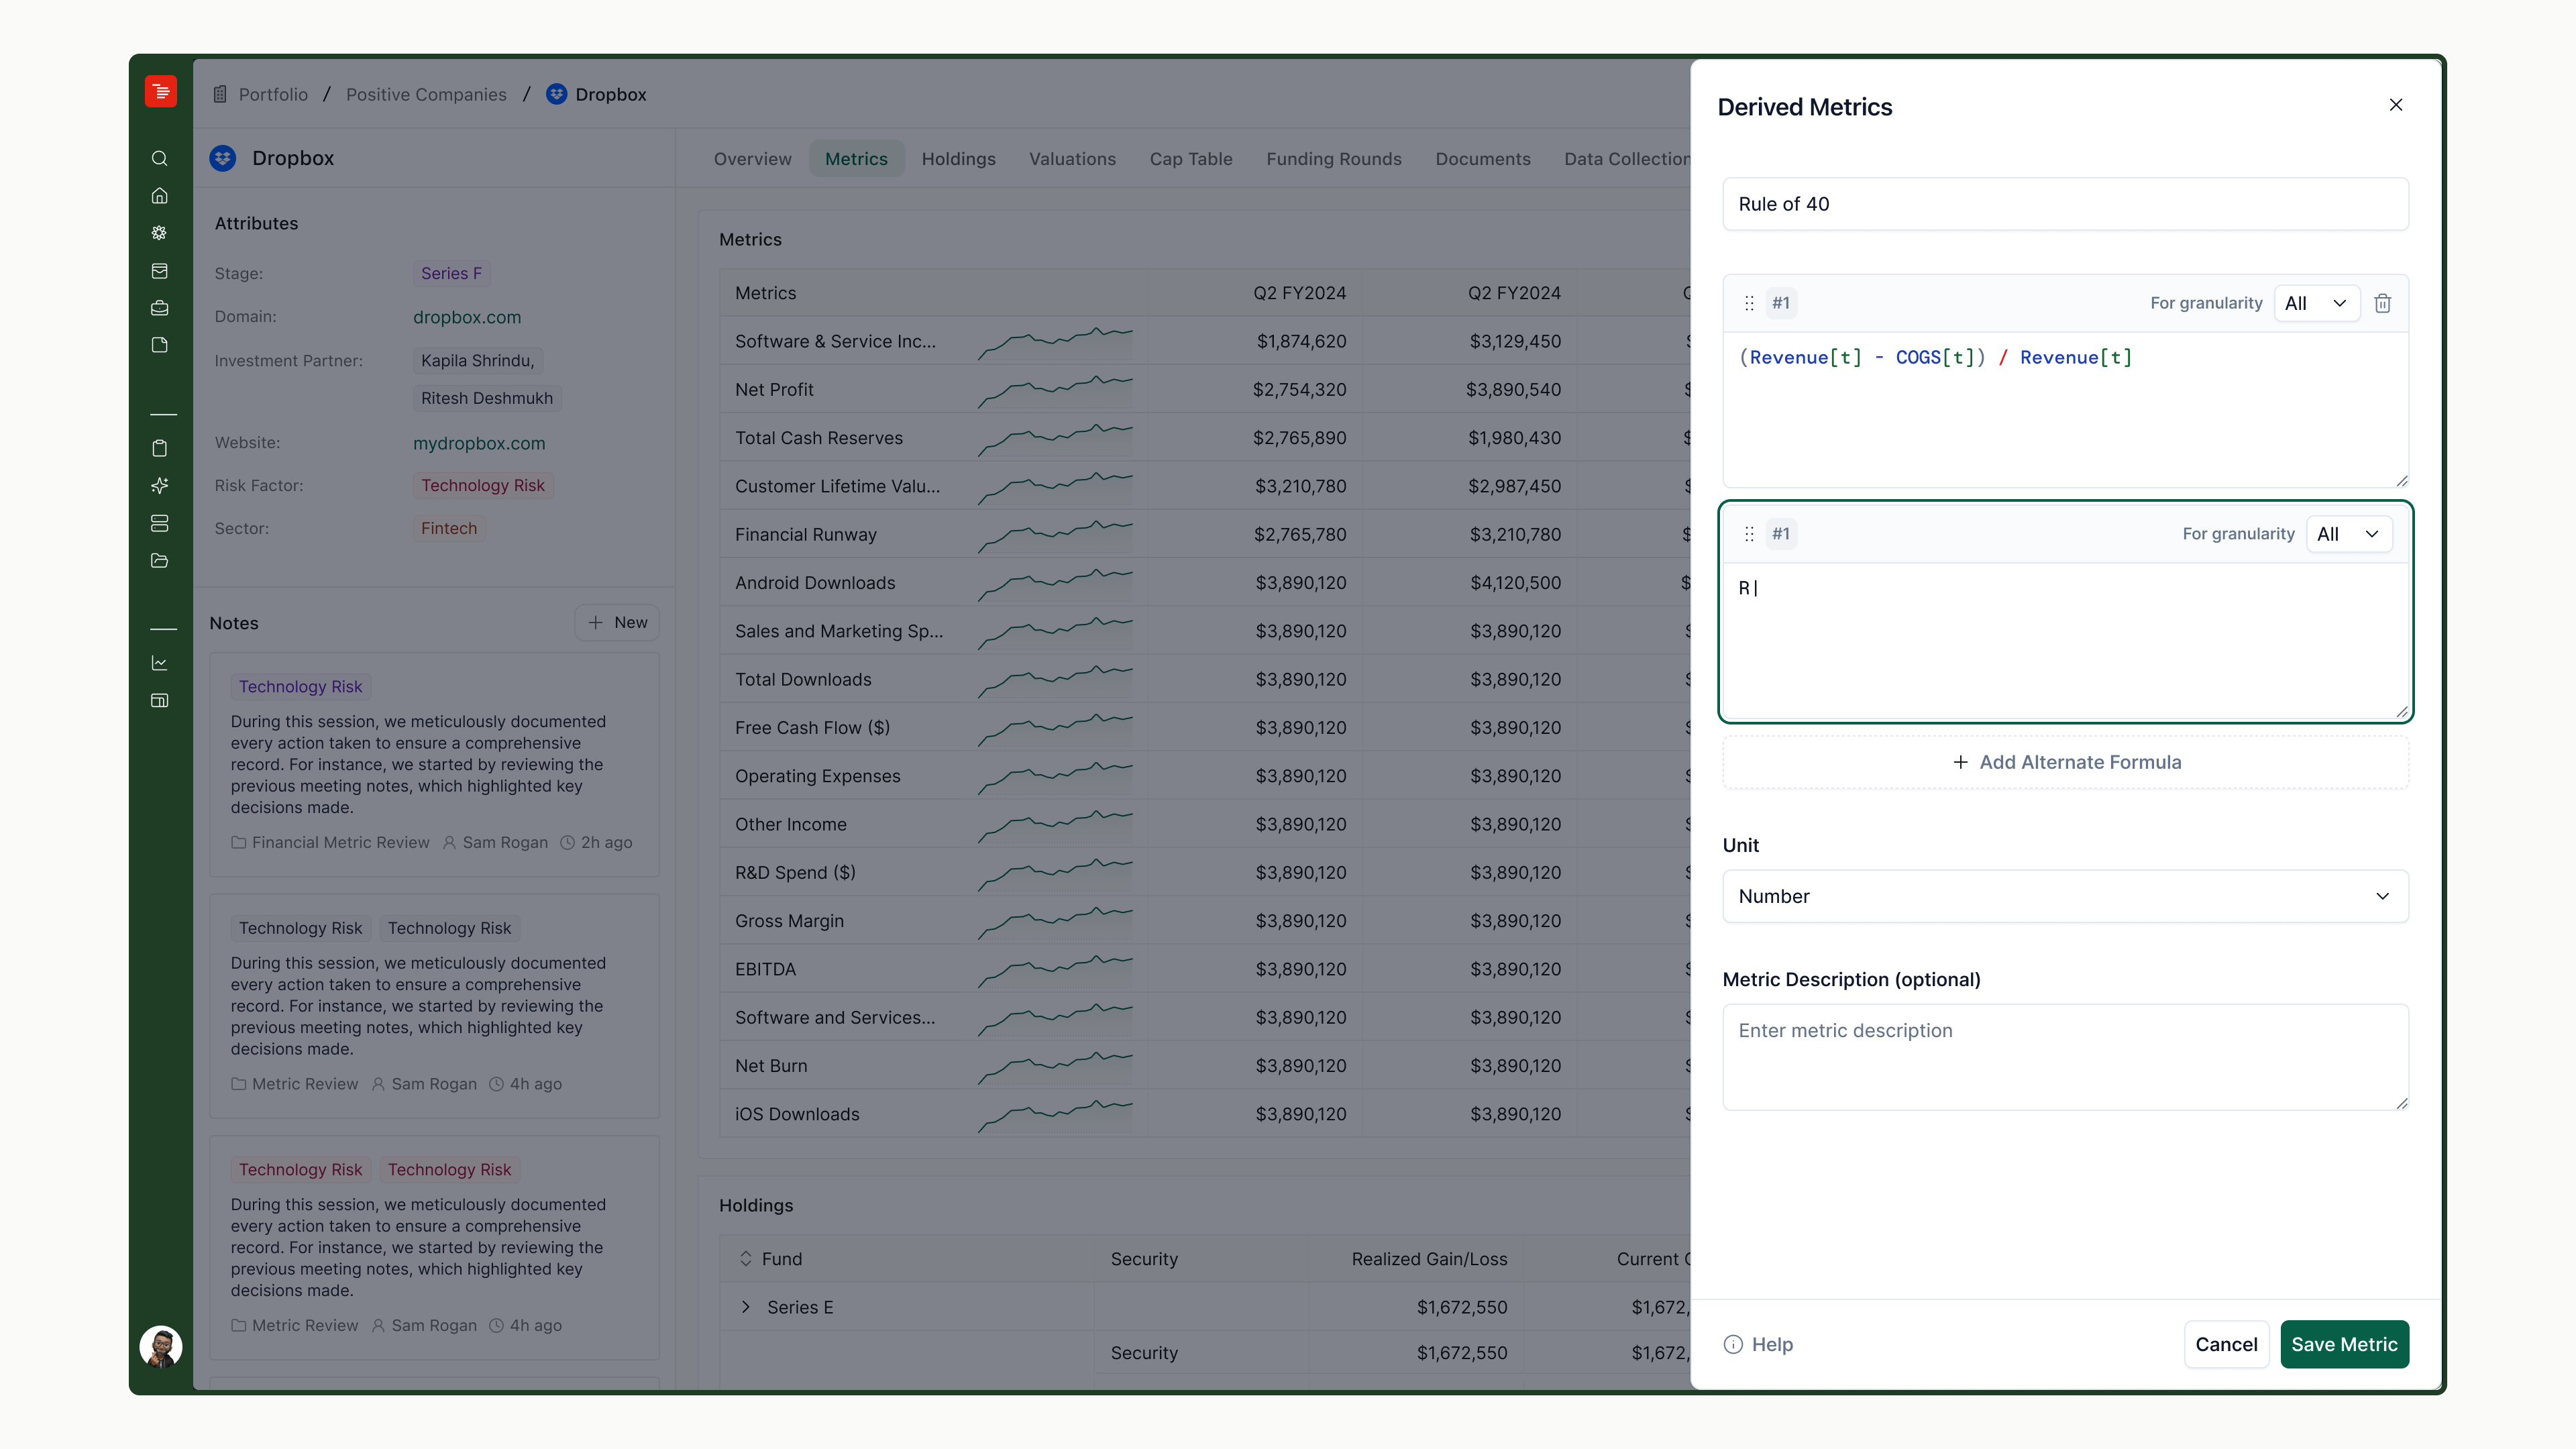
2. Computation engine enhancements
Derived metrics now participate in roll-ups, extending population priority from V1's two steps to three: reported value, rolled-up reported metric, then rolled-up derived value itself. Execution runs as a full dependency-graph traversal, and the three V1 failure states split into distinct, logged reasons per period instead of one blank cell. The "-" state matures into an actual diagnostic.
3. Bulk creation system Shipped
An admin defines a formula once at the org level (a Global Derived Metric Template, or GDMT), which resolves to every company's local mappings automatically, with a downloadable resolution report, auto-apply to new companies, and a per-company "reset to GDMT" action. This is the piece that turns "define a metric 150 times" into "define a metric once."
Guardrails
| Constraint | Reason |
|---|---|
| Max 5 formulae per fallback chain; max dependency depth of 5 | Bounds evaluation legibility and how far a topological sort has to go before failing gracefully |
| Bulk creation is admin-only and errors on an existing mapping | Individual creation stays open to all users; prevents a GDMT from silently overwriting a company's metric |
| Roll-up method appropriateness is the user's responsibility | The system won't second-guess whether SUM vs. AVERAGE is semantically correct |
5What I'd revisit before a V3
The biggest shift from V1 to V2 wasn't the formula language. It was who the user became. V1 was designed for one investor building one metric; V2 had to hold up for an operations team standardizing hundreds of metrics across a portfolio, where a silently-broken formula doesn't just confuse one person, it corrupts a fund-level number. That's why the guardrails exist as hard limits rather than warnings, and why cycle detection errs conservative even at the cost of occasionally rejecting a formula that would've worked fine.